Century 21 People’s Choice Realty Inc., Brokerage
120 MATHESON BLVD E #103
MISSISSAUGA, Ontario
L4K 0A4
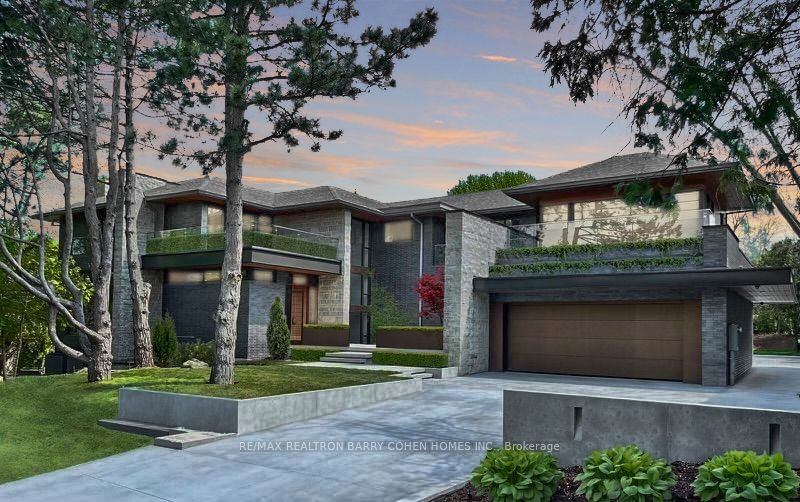


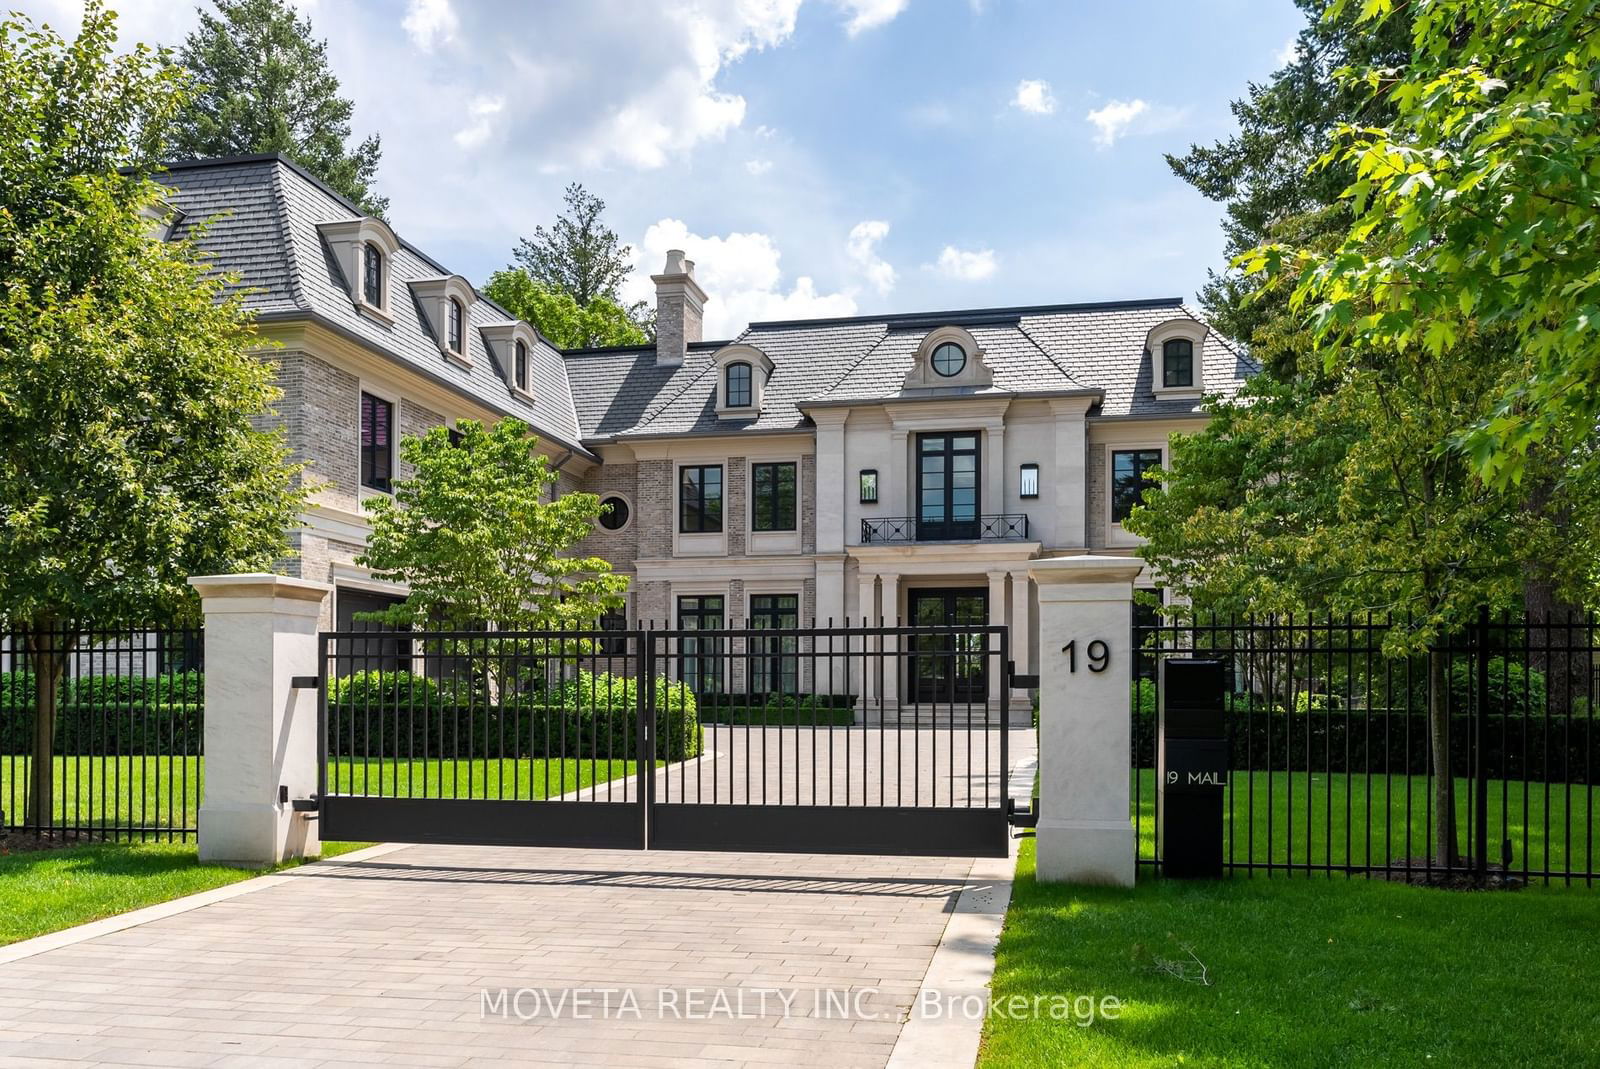
Toronto, St. Andrew-Windfields, M2L 2K3
$19,995,000
Listed by RE/MAX REALTRON BARRY COHEN HOMES INC..
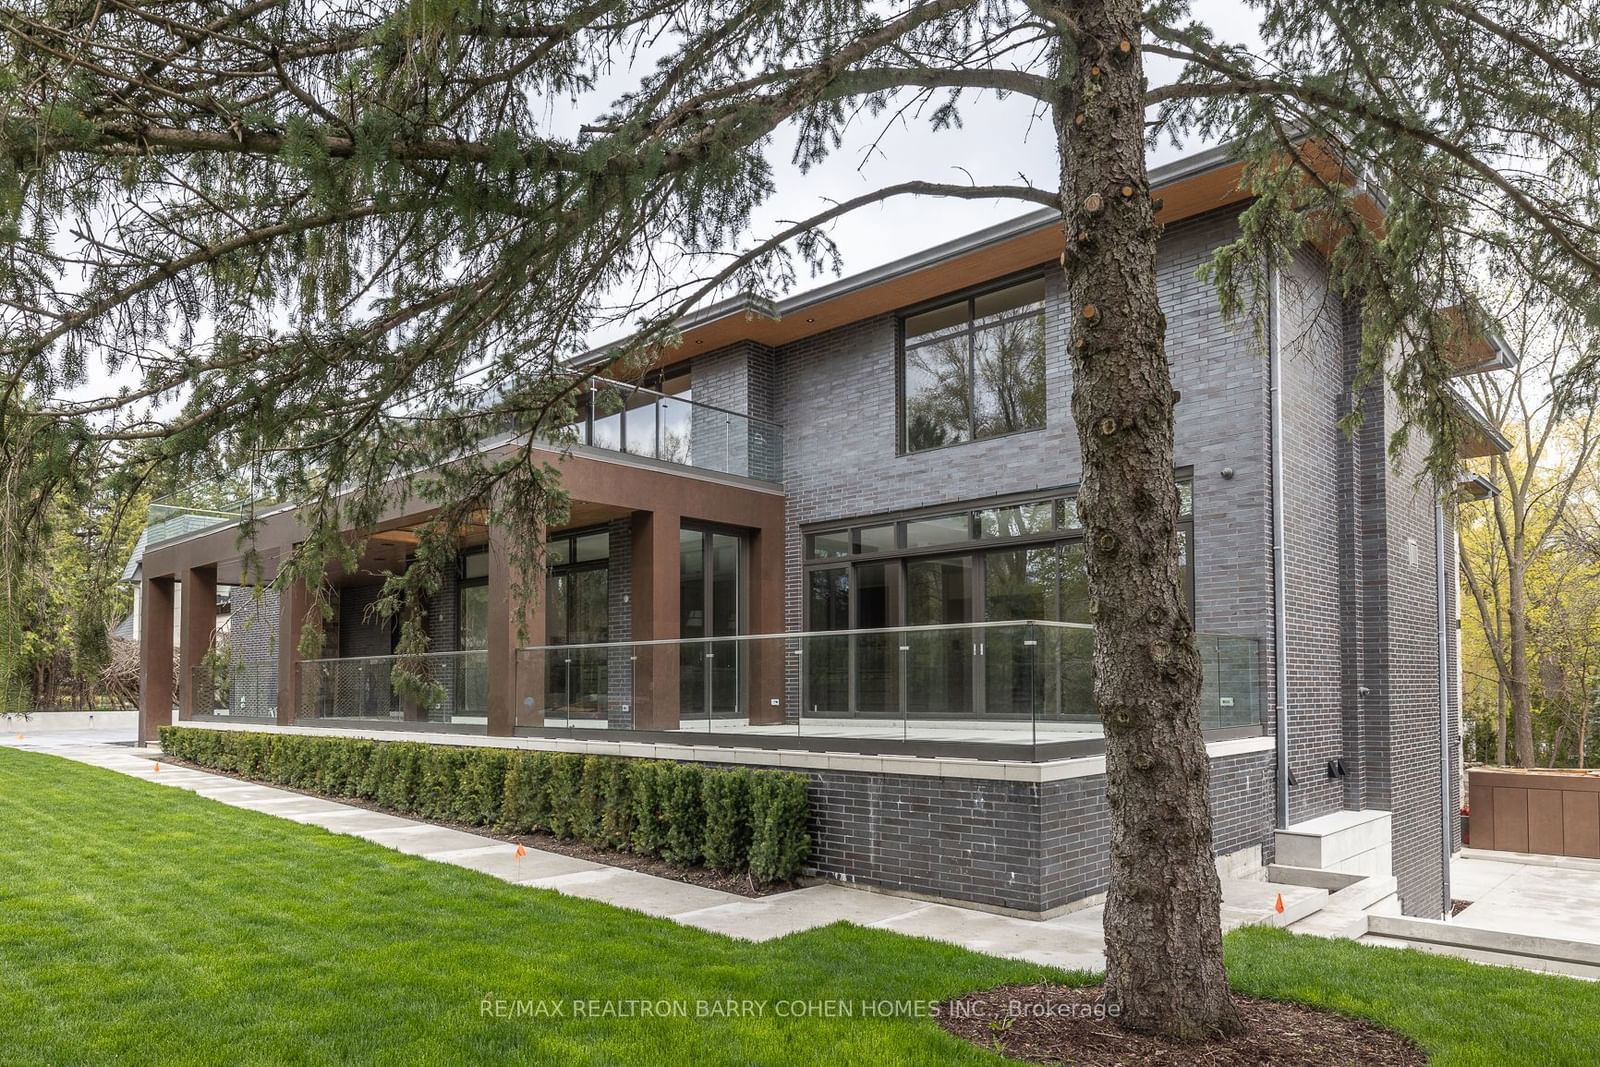
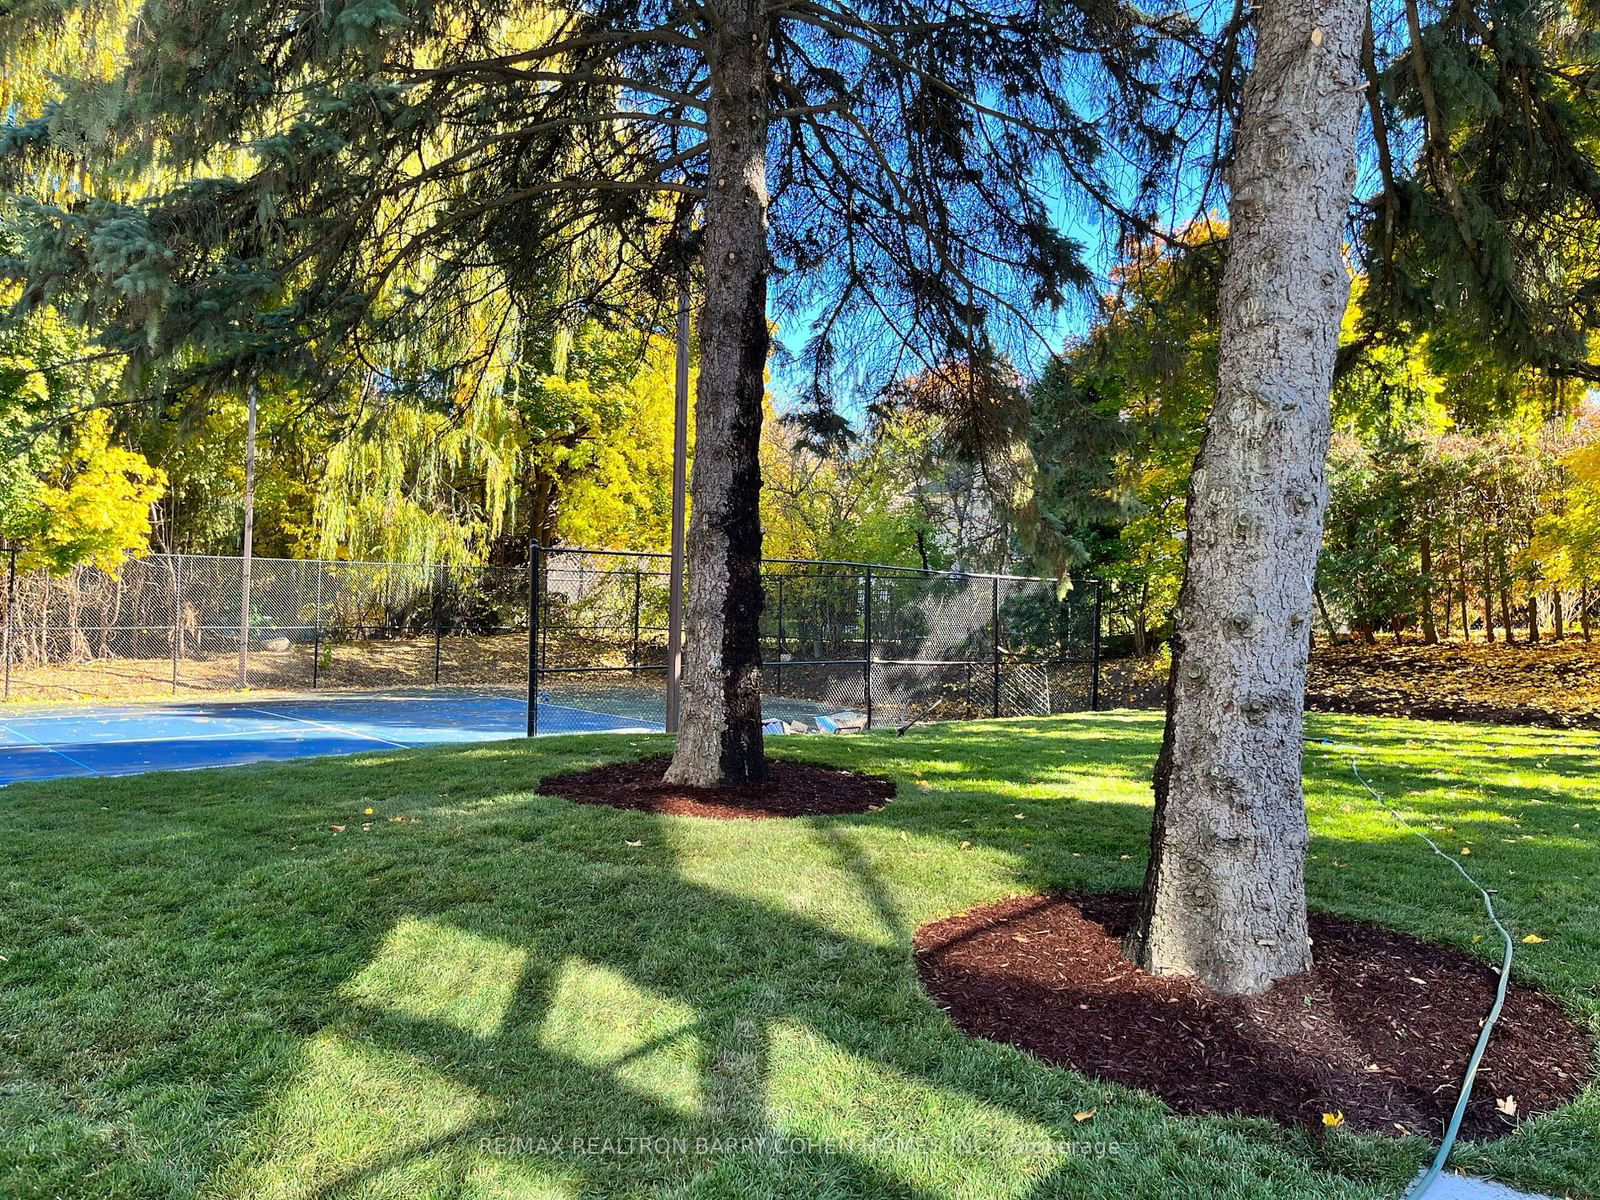
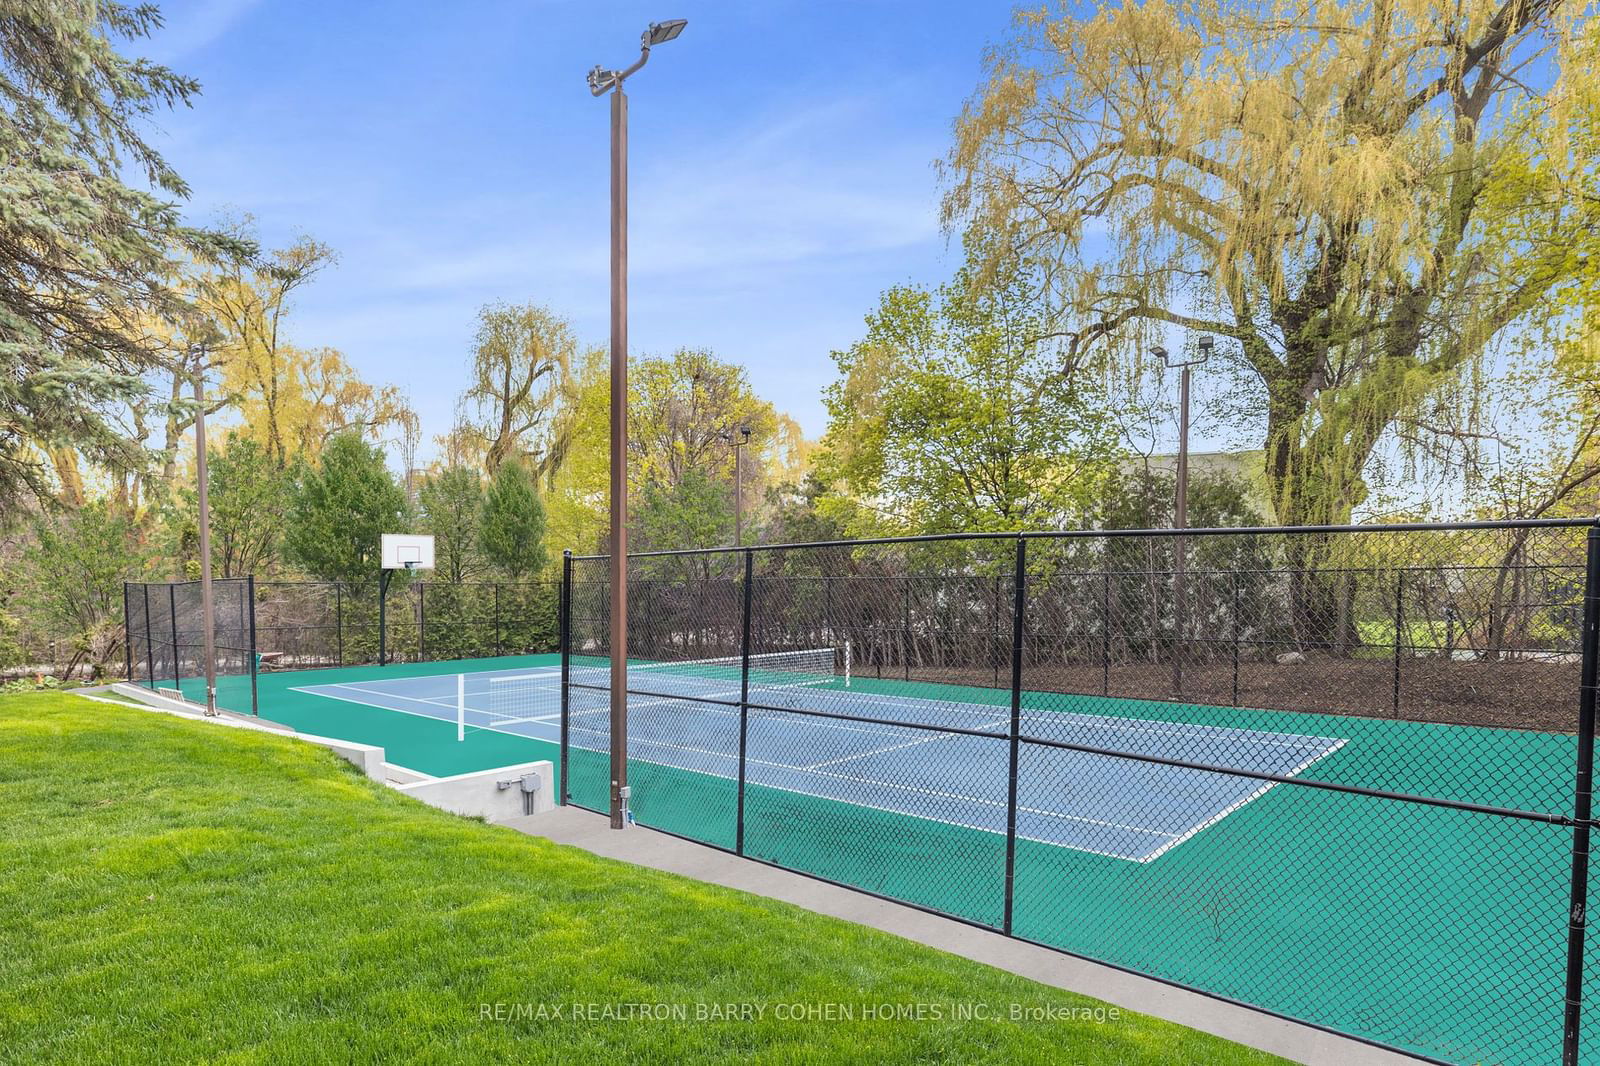
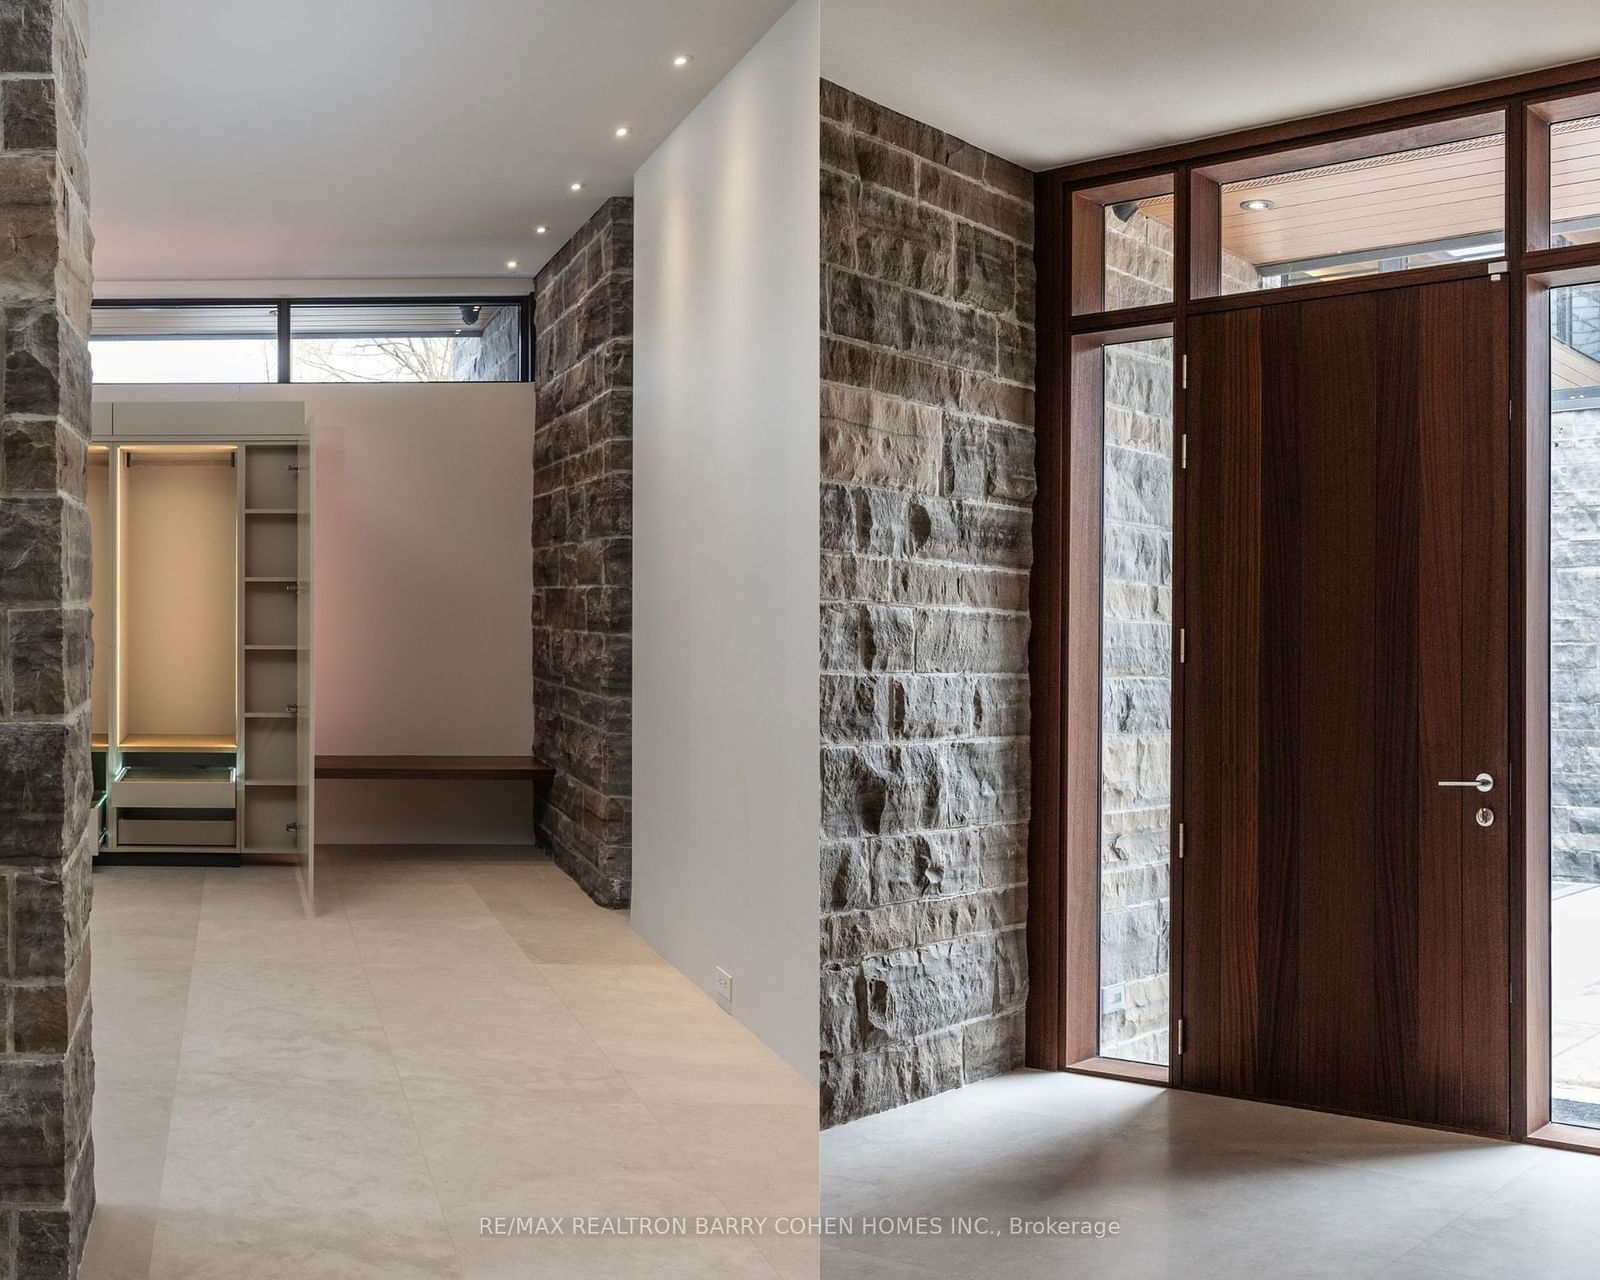
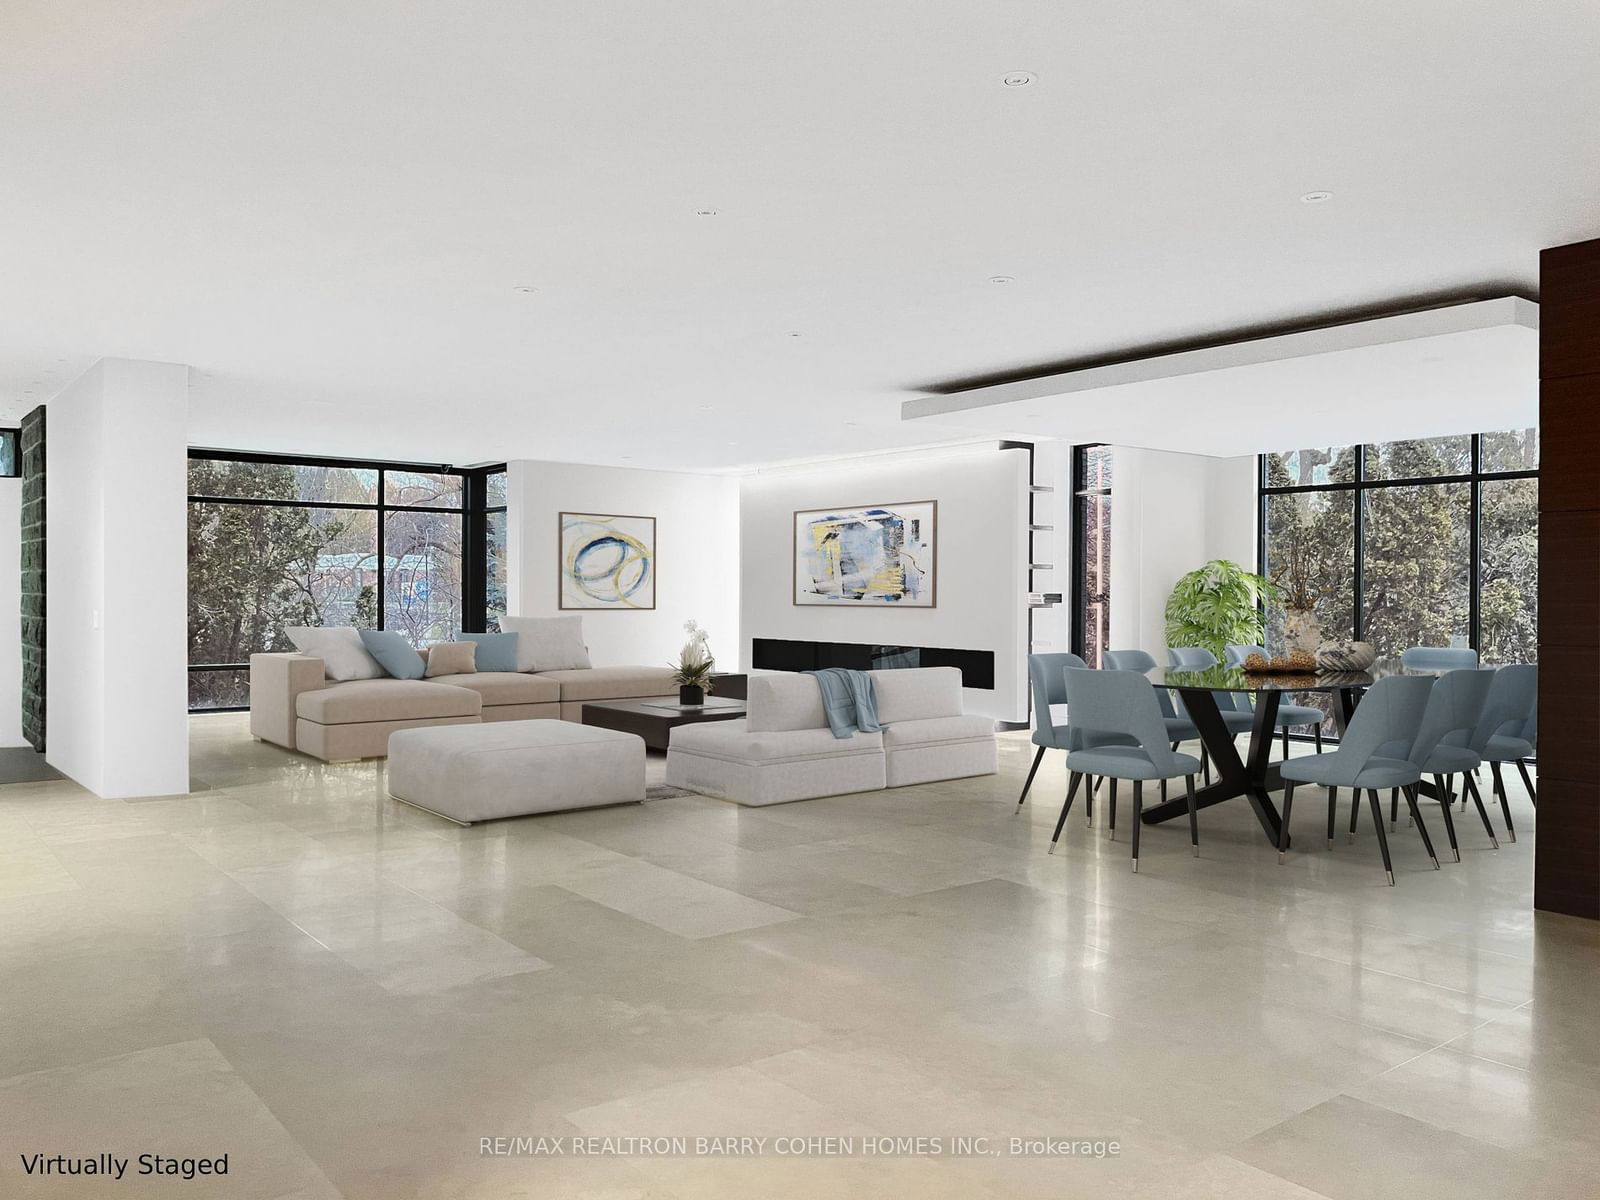
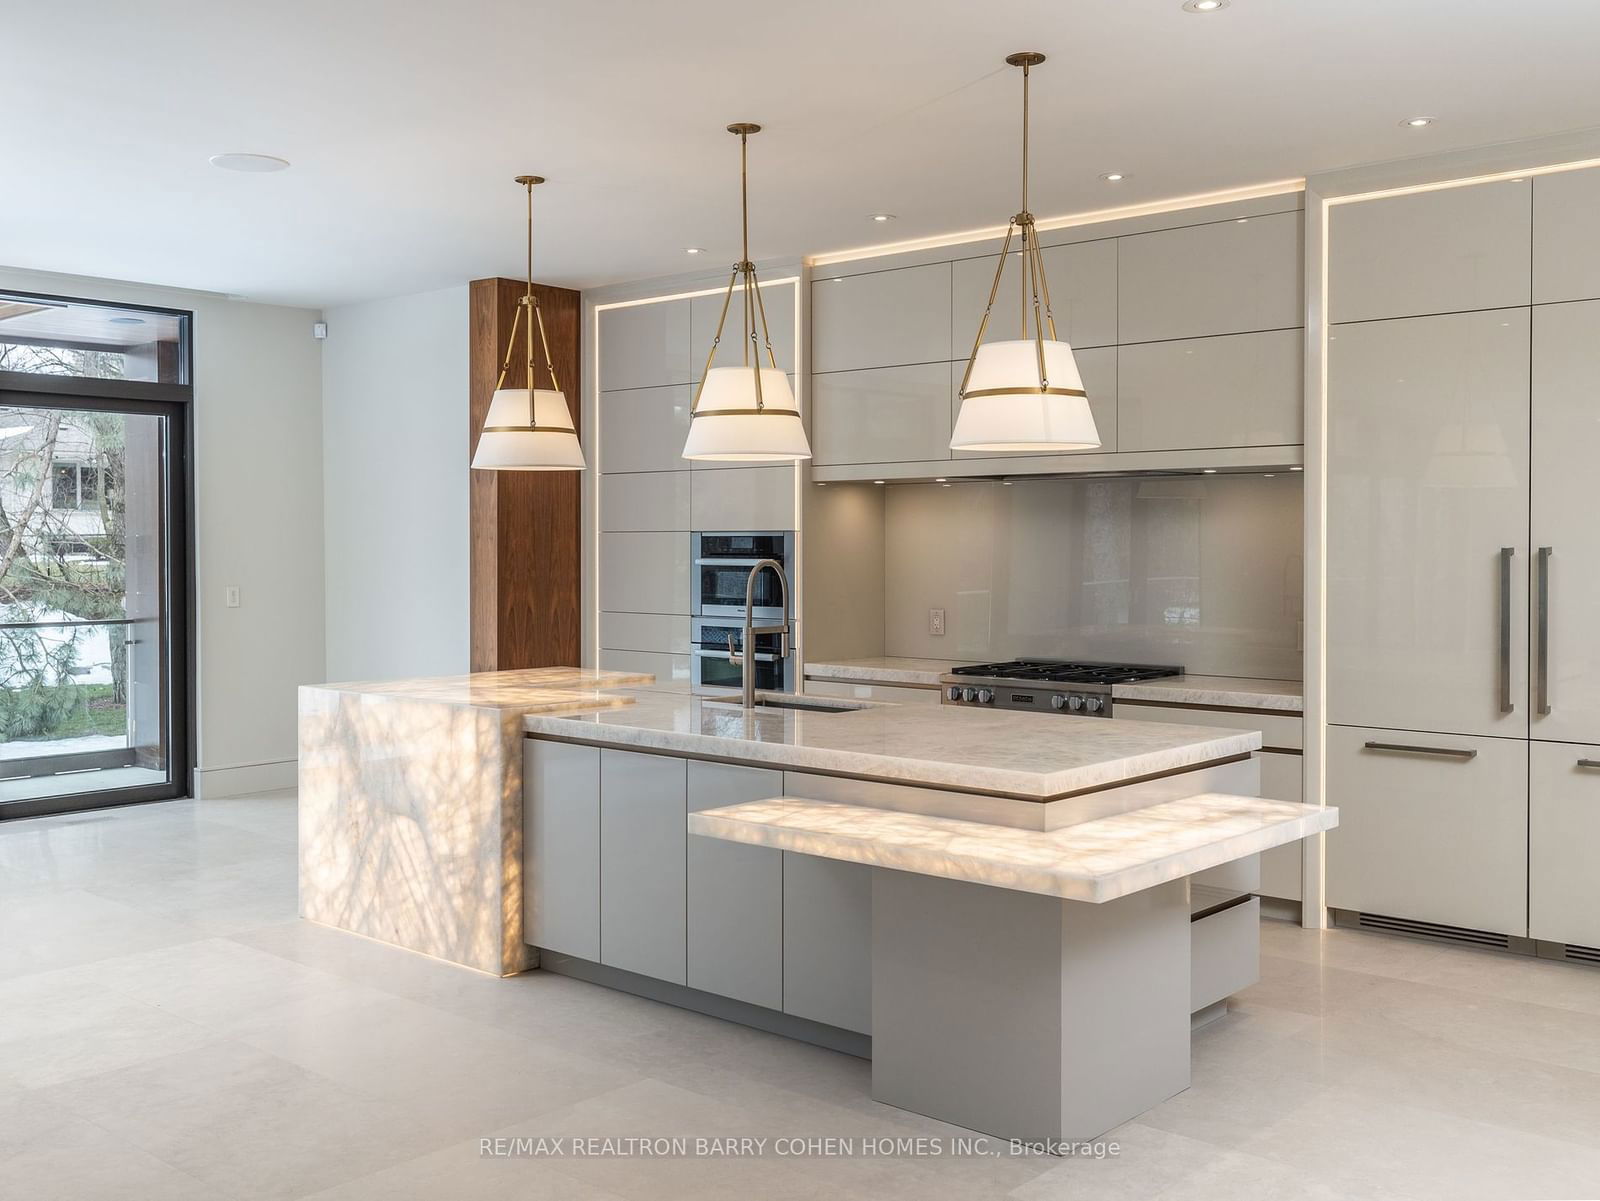
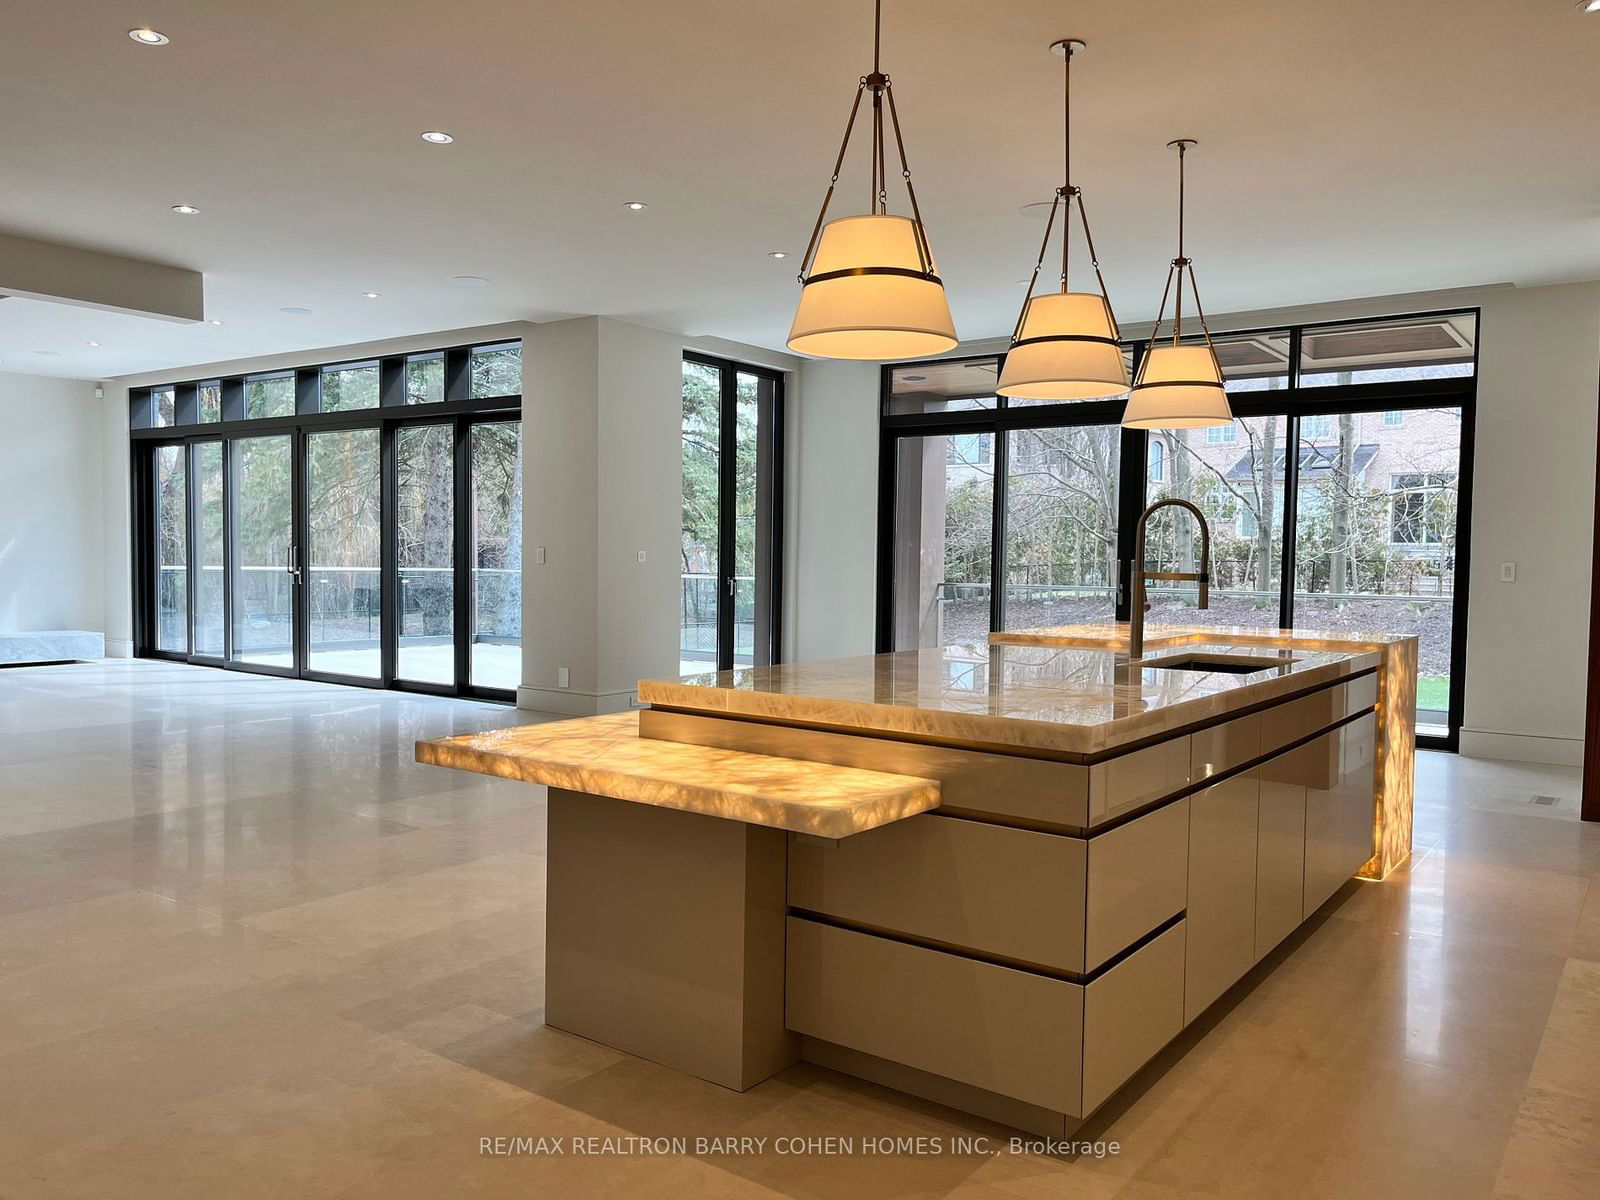
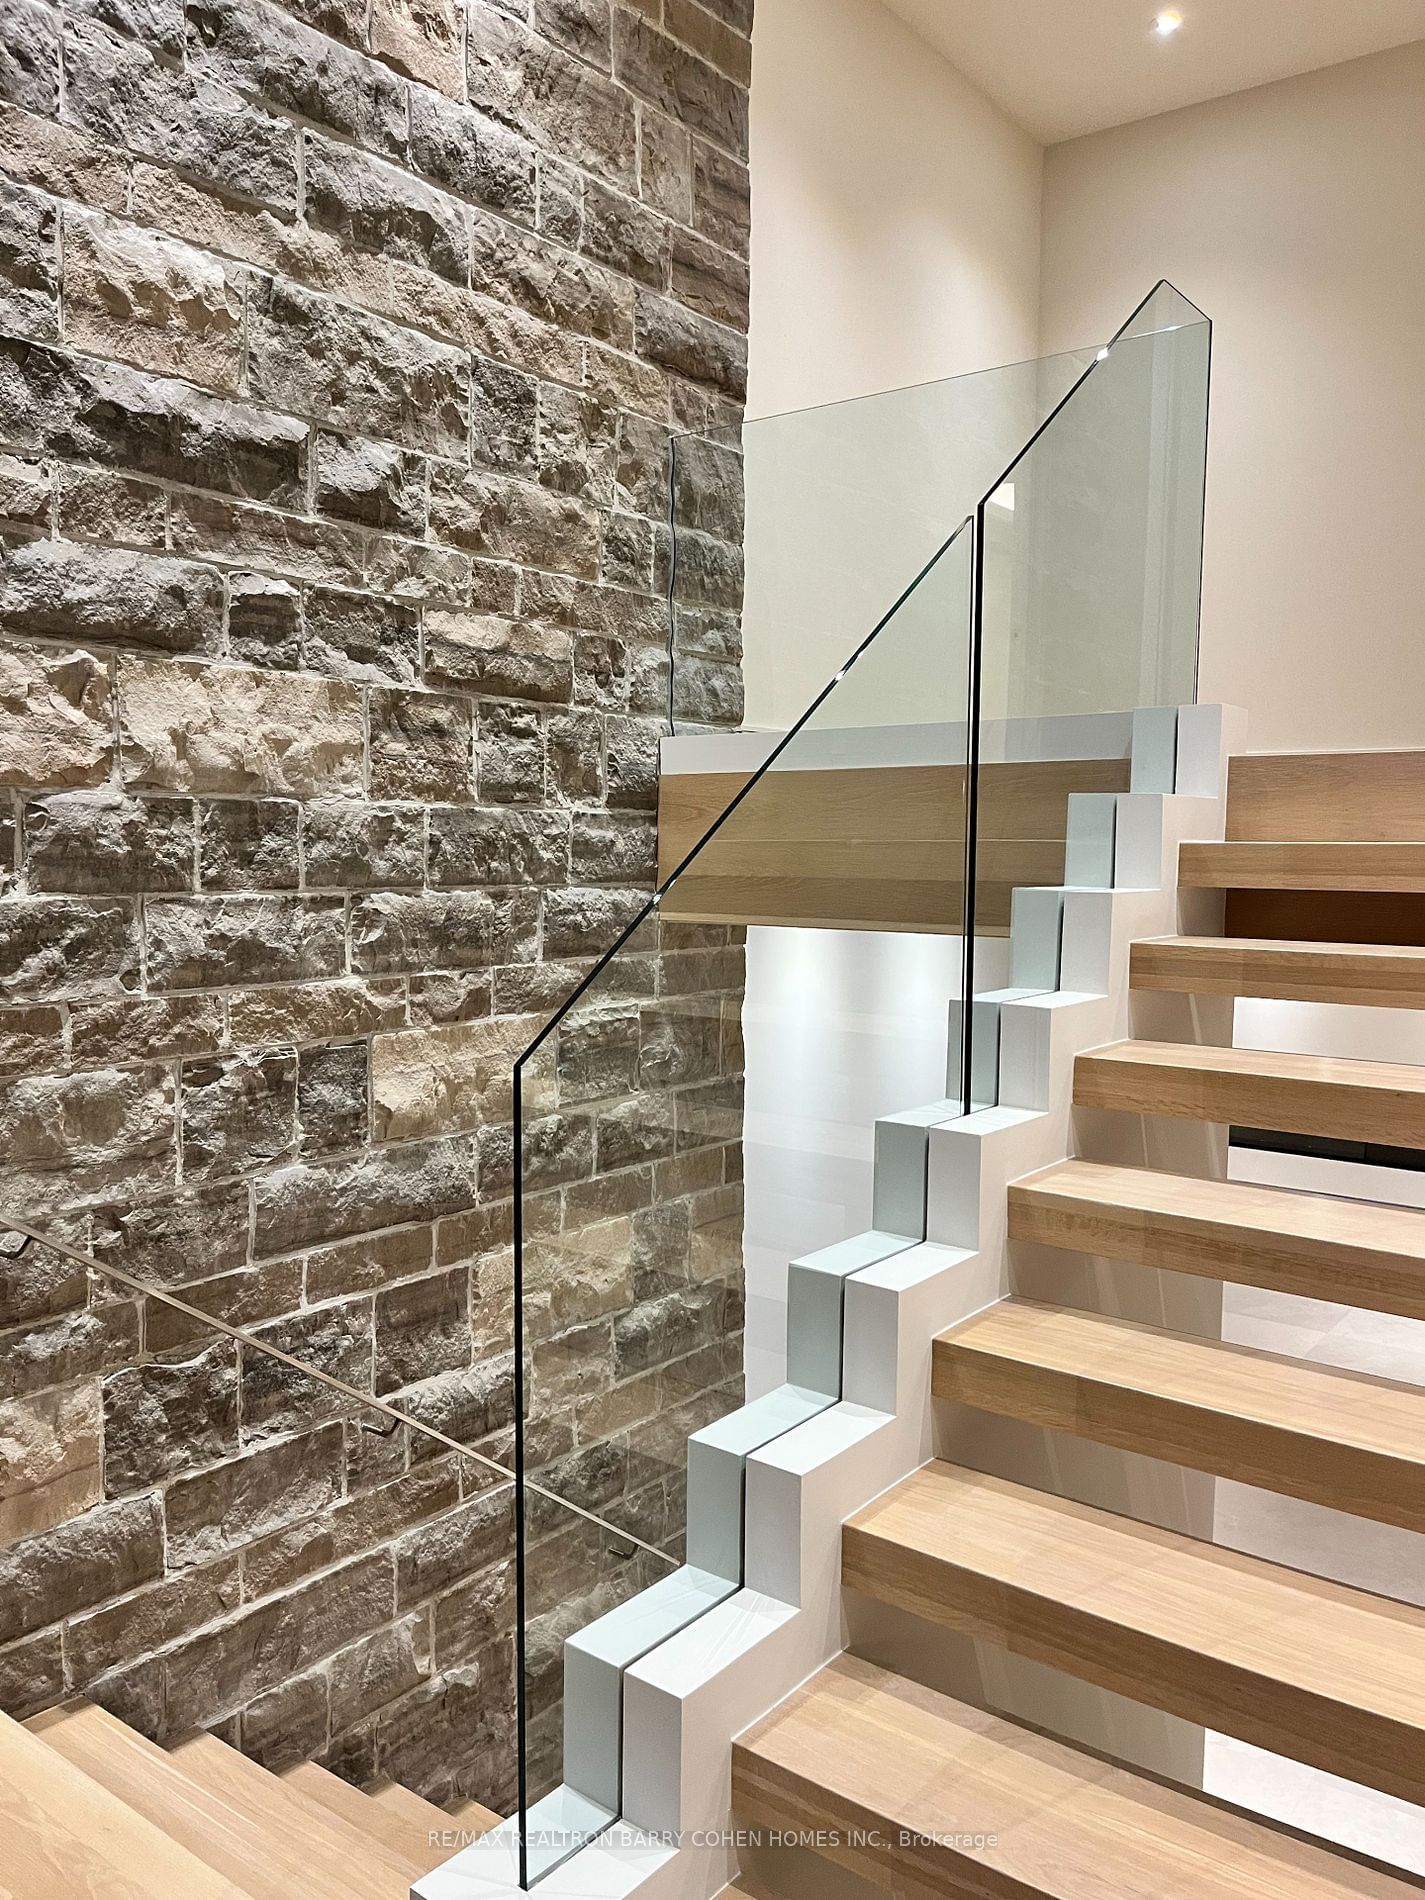
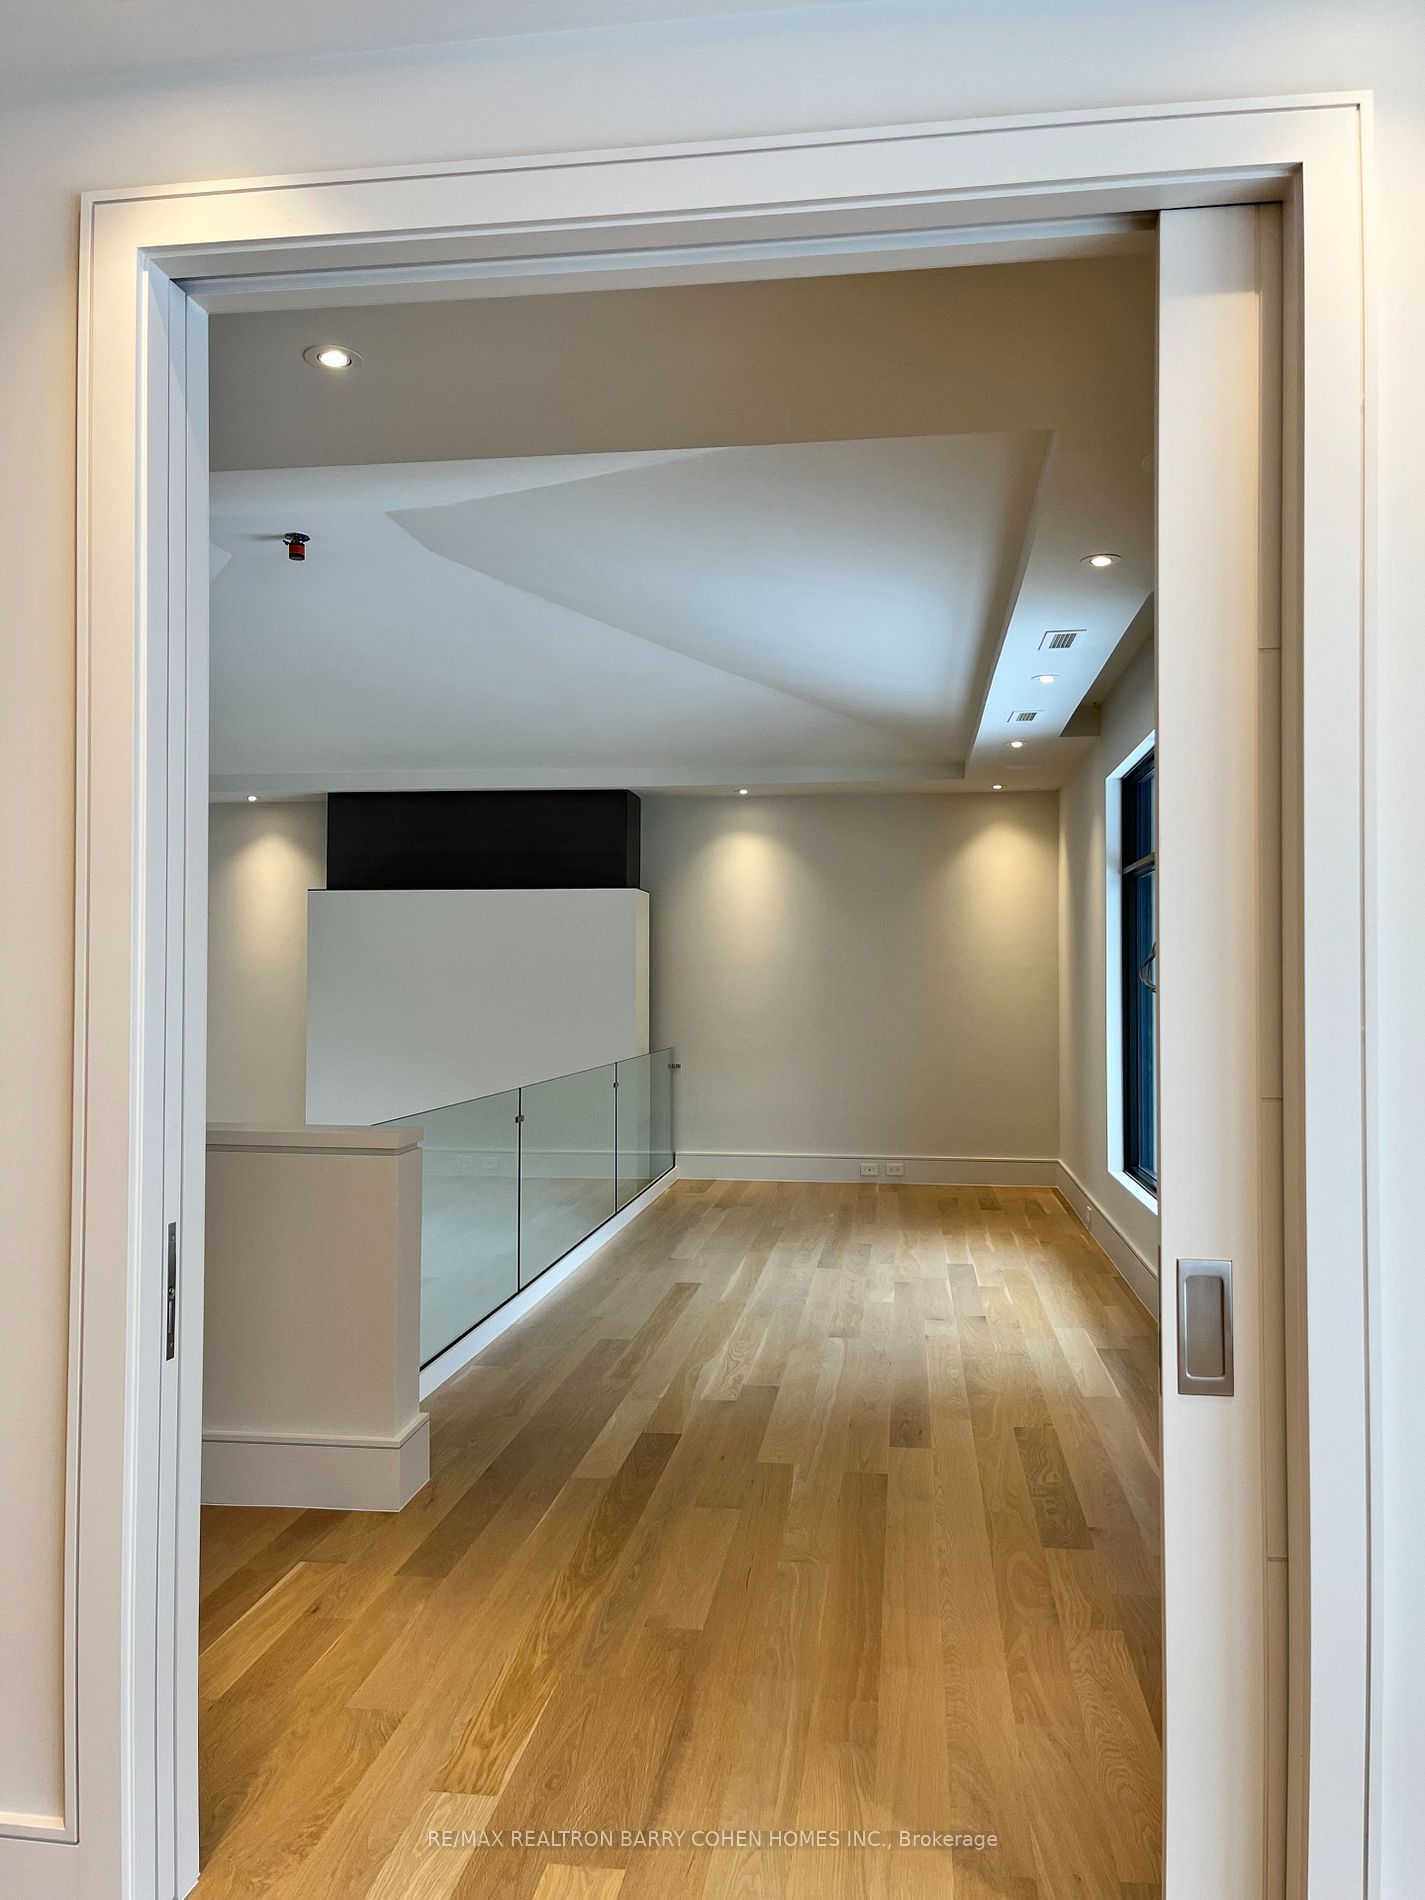
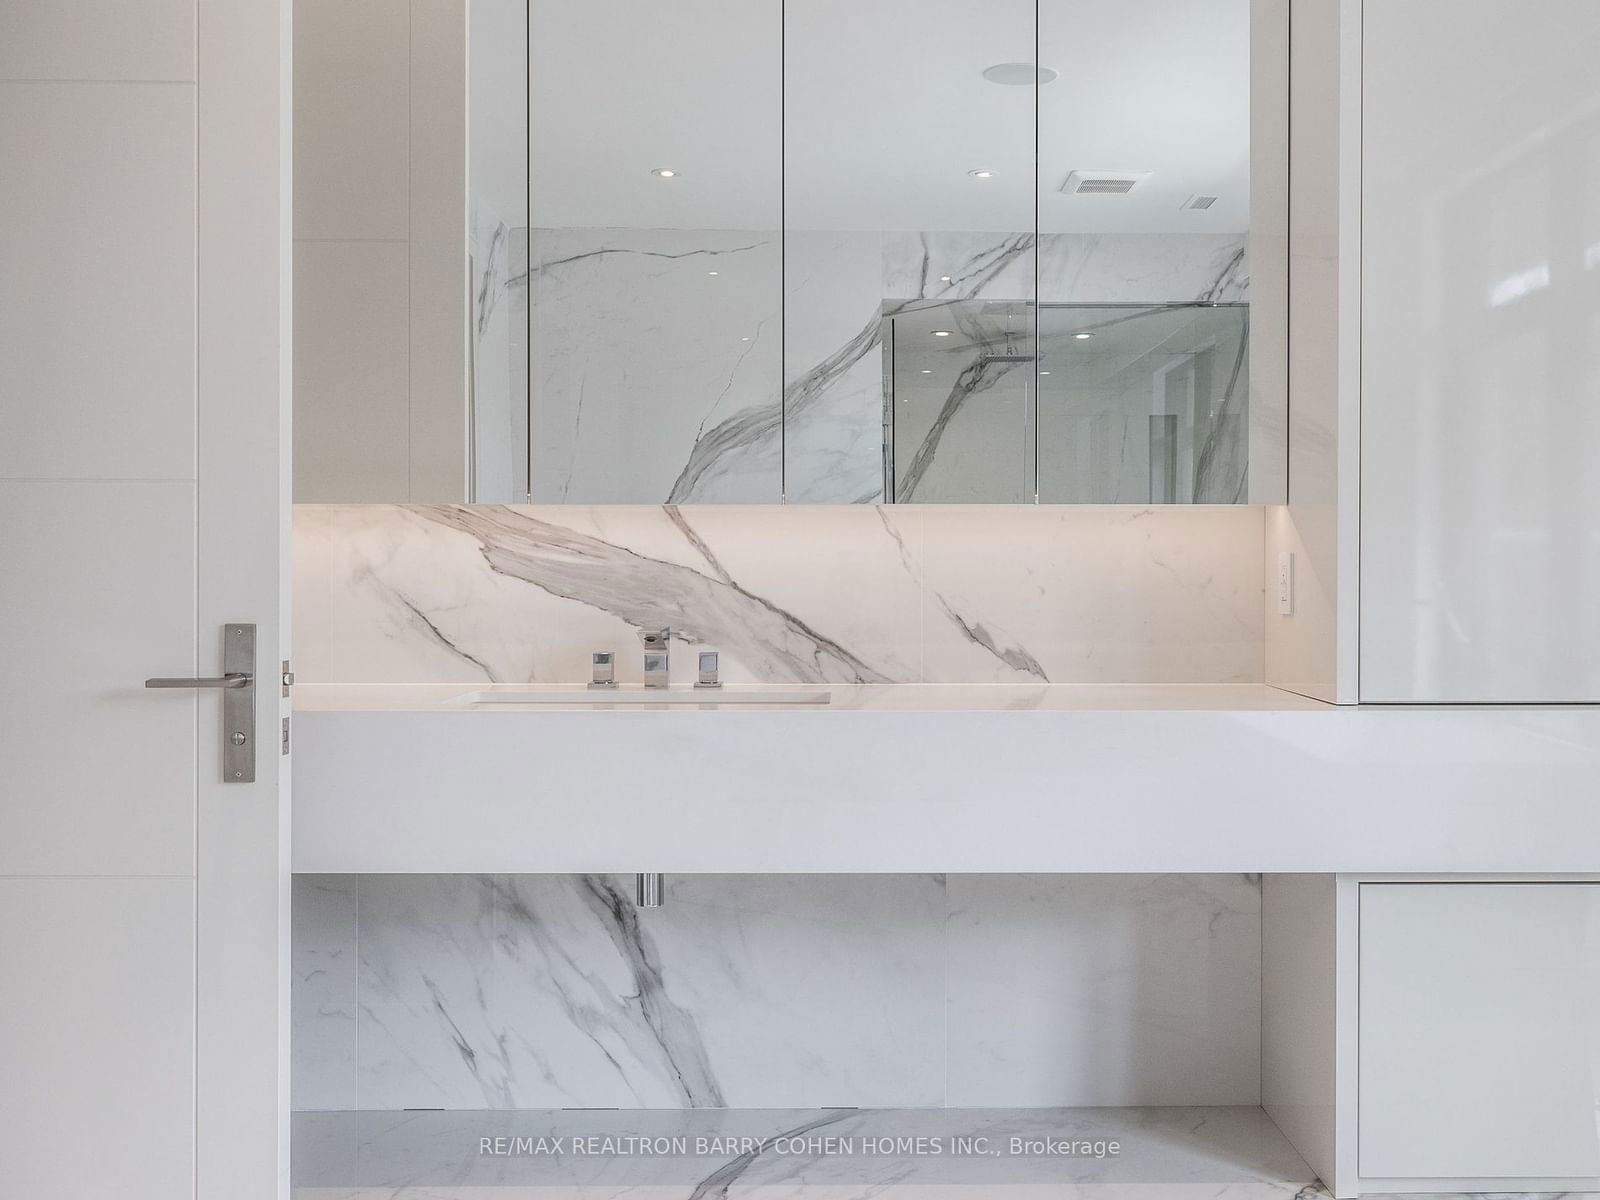
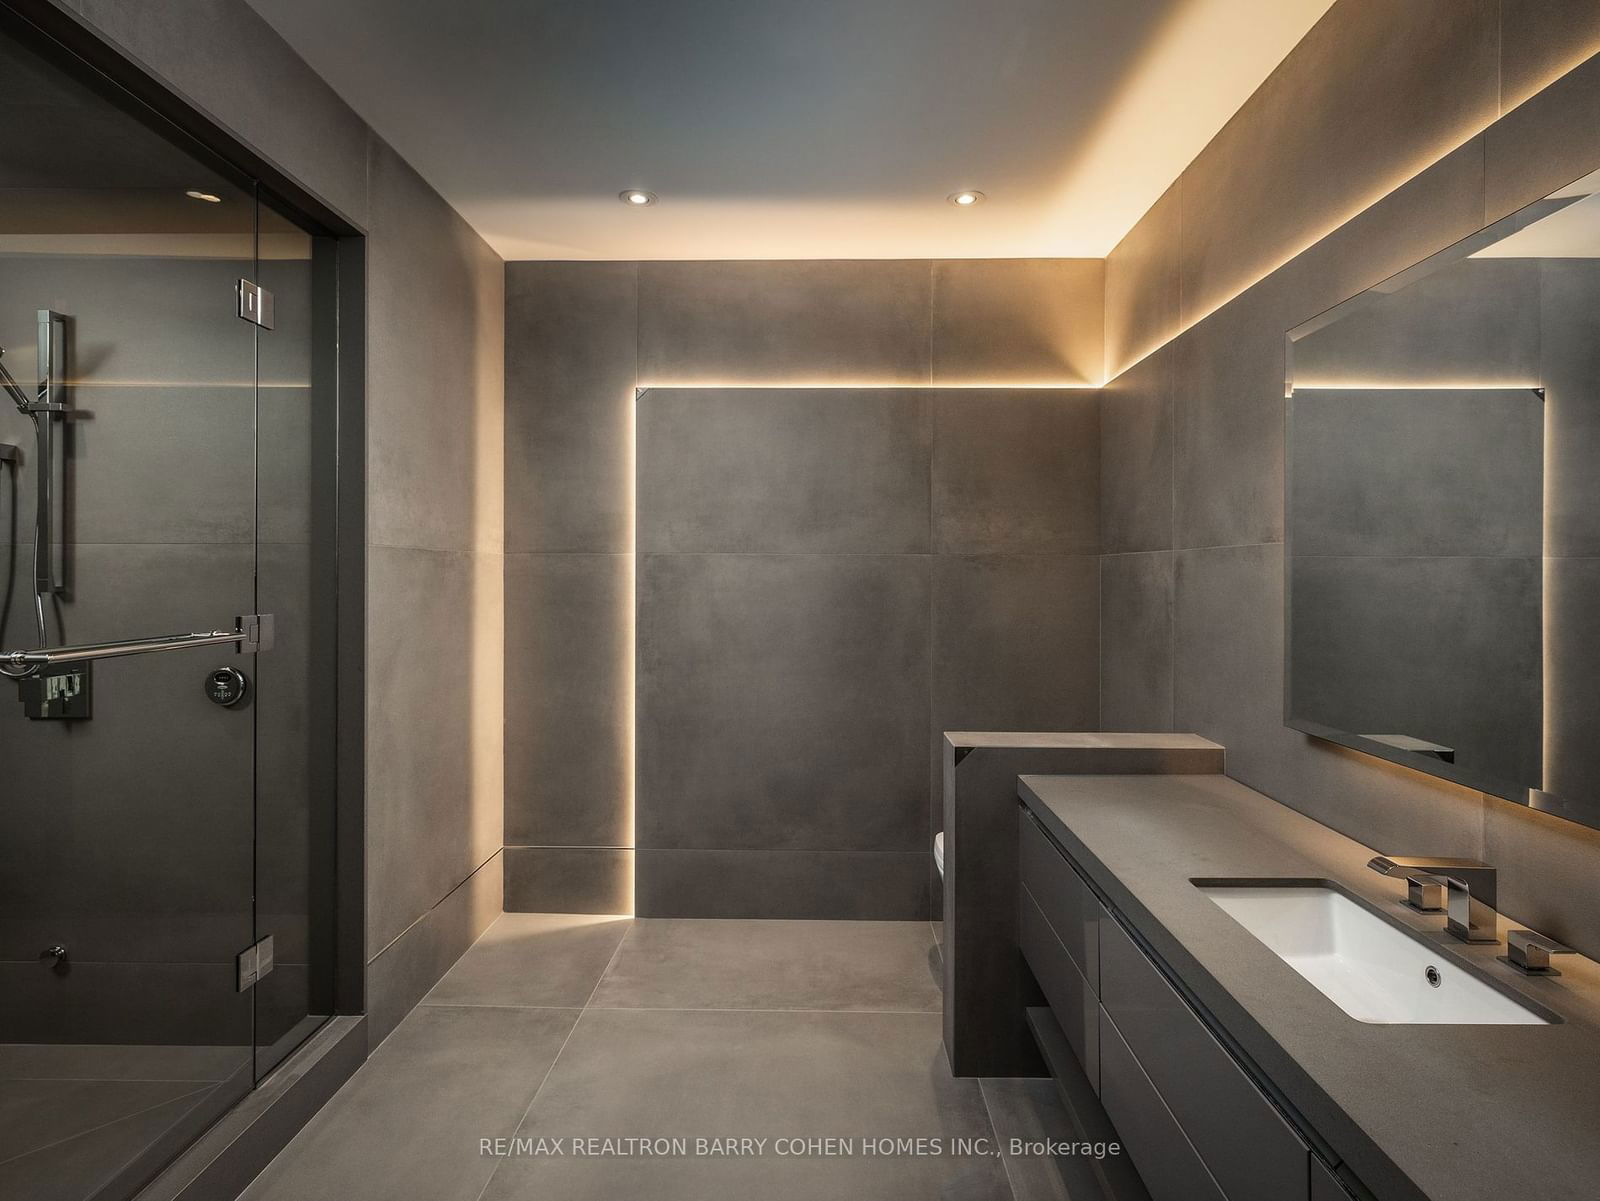
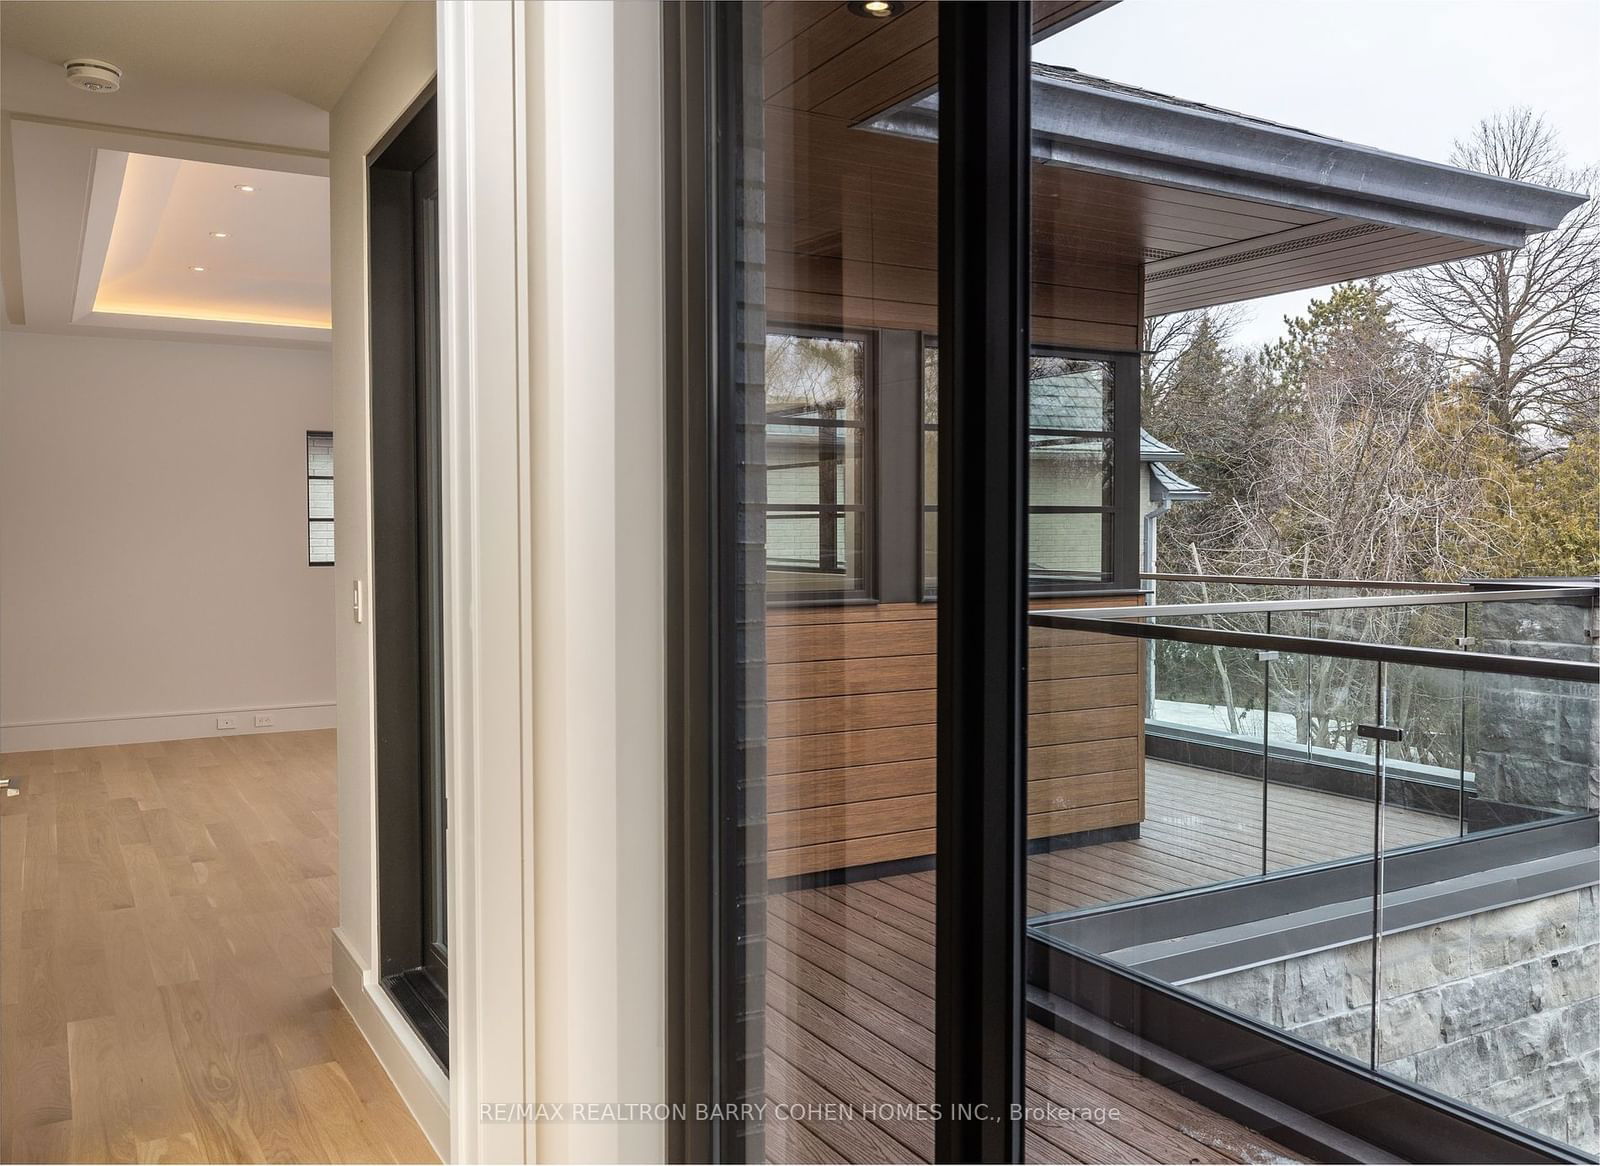
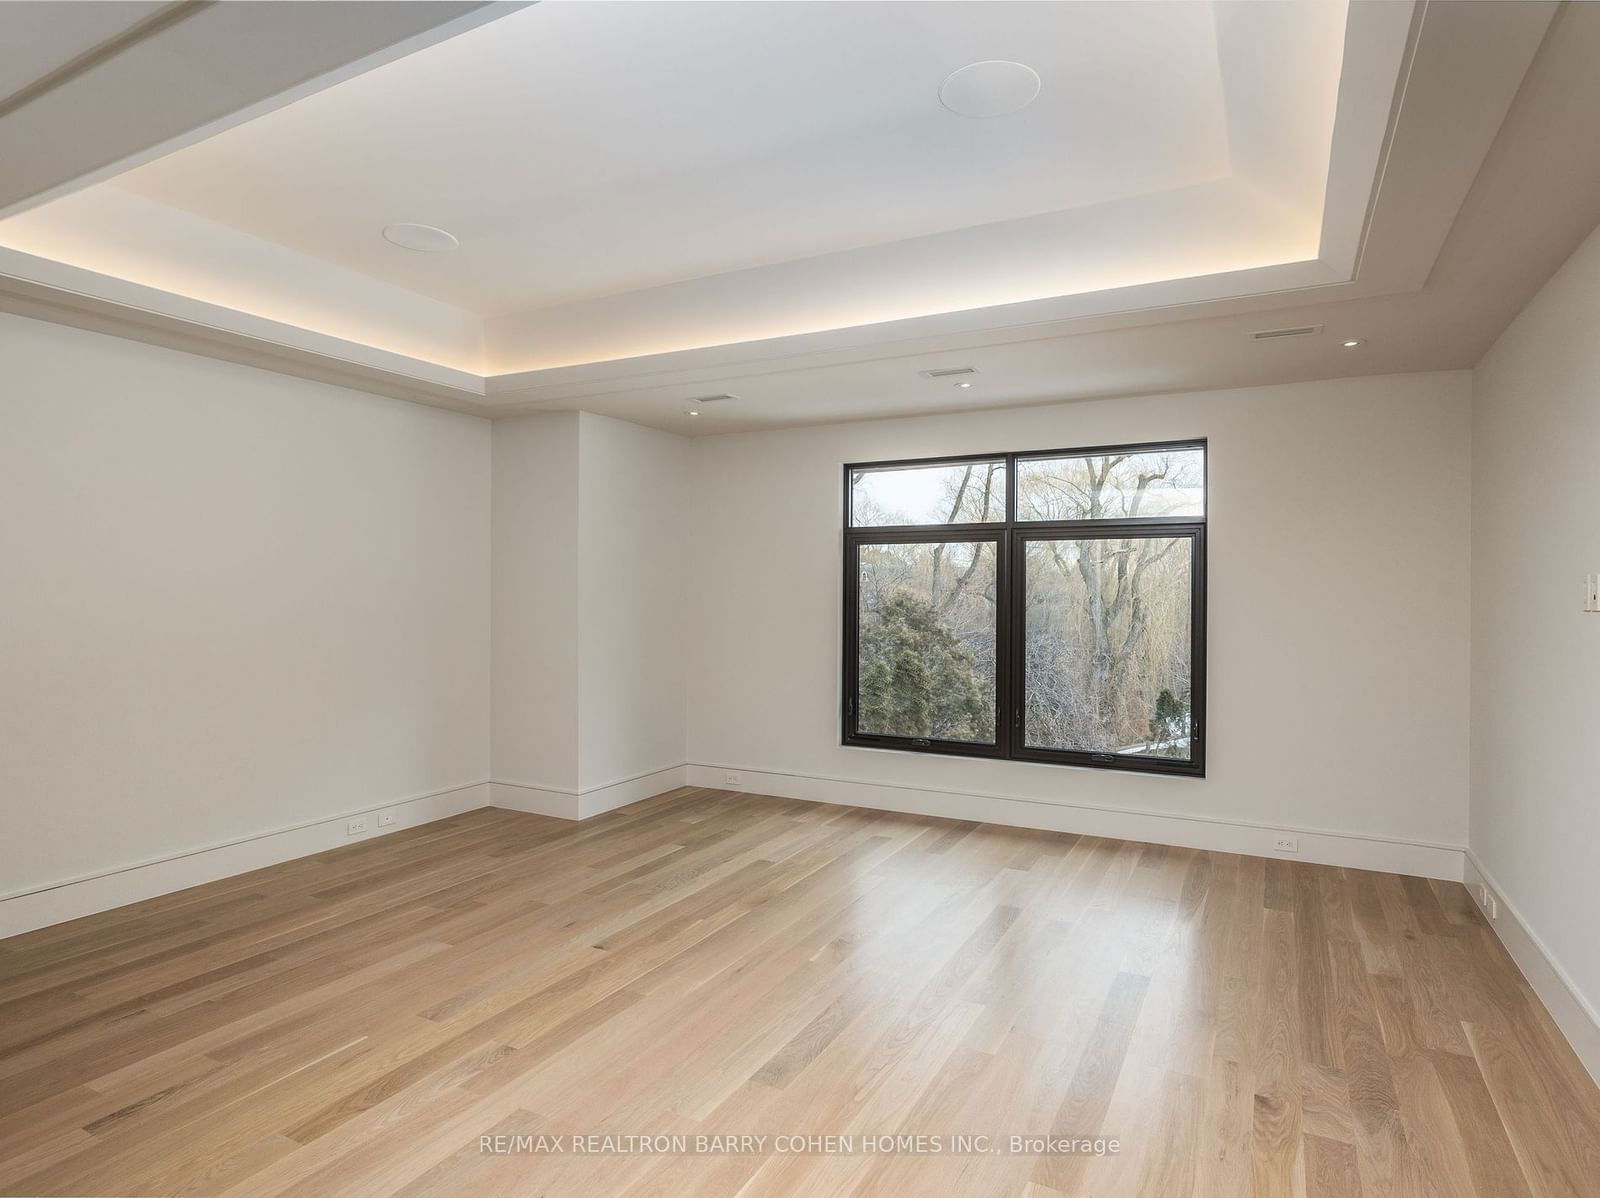
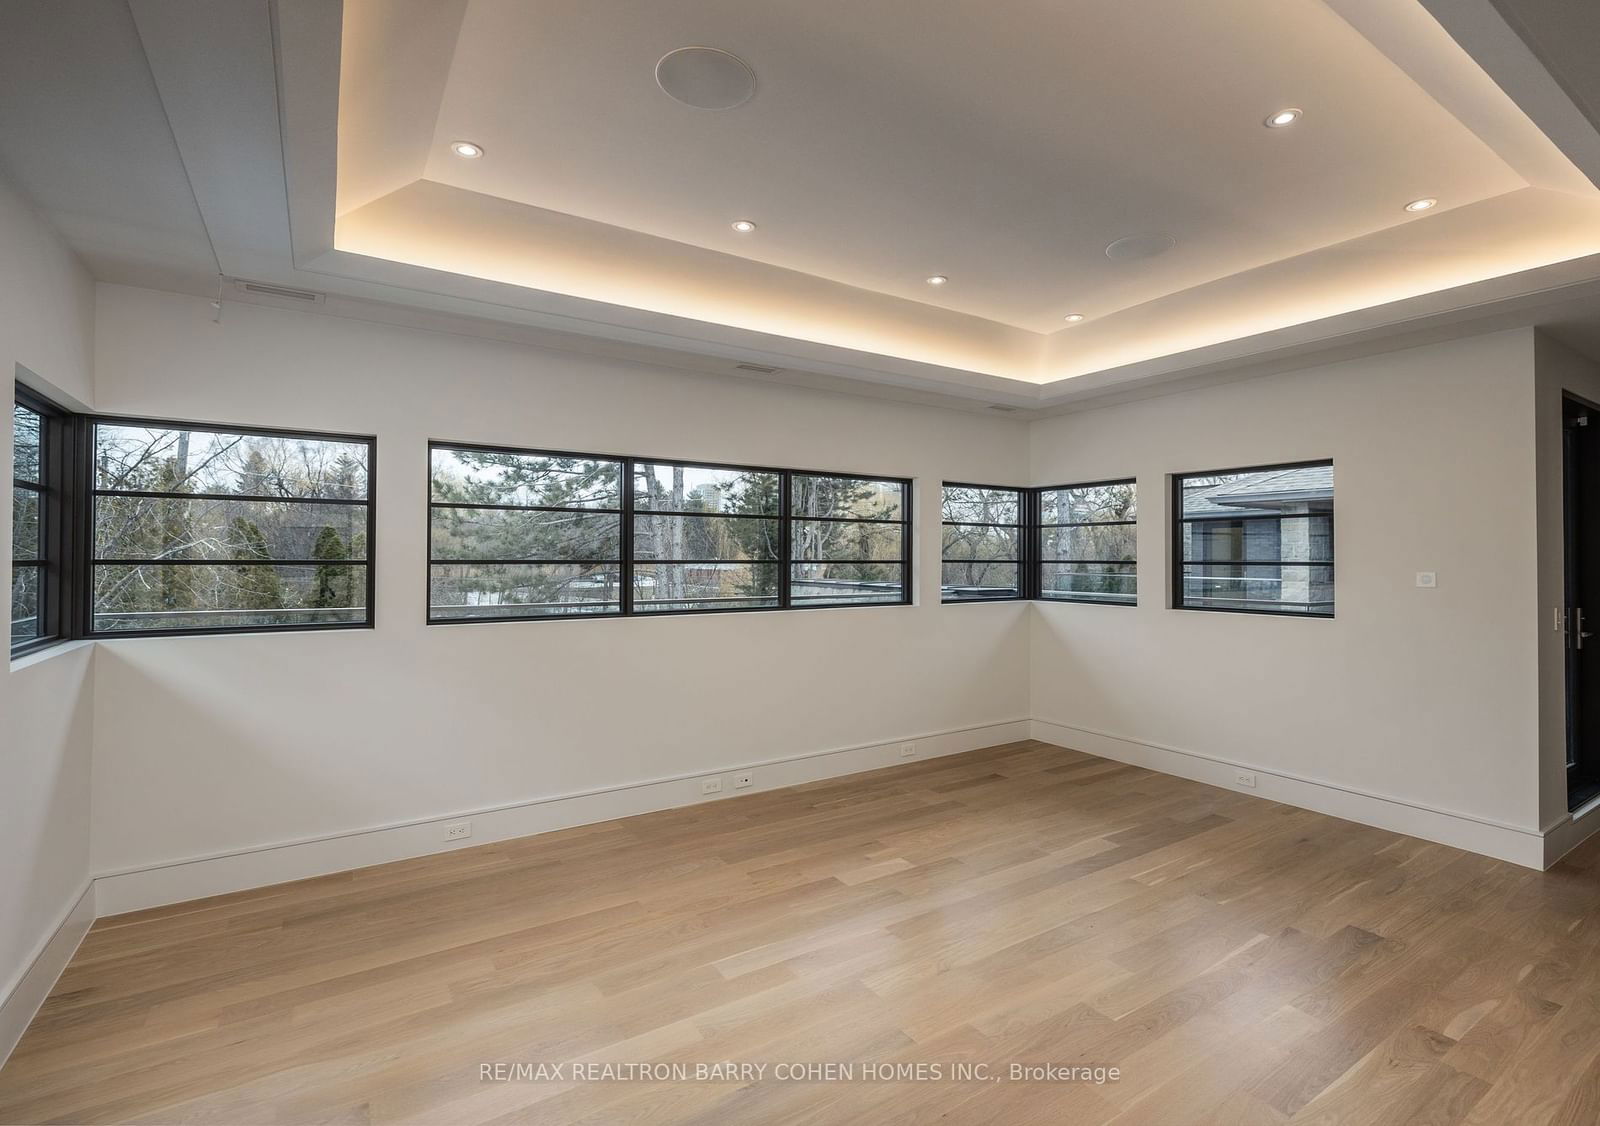
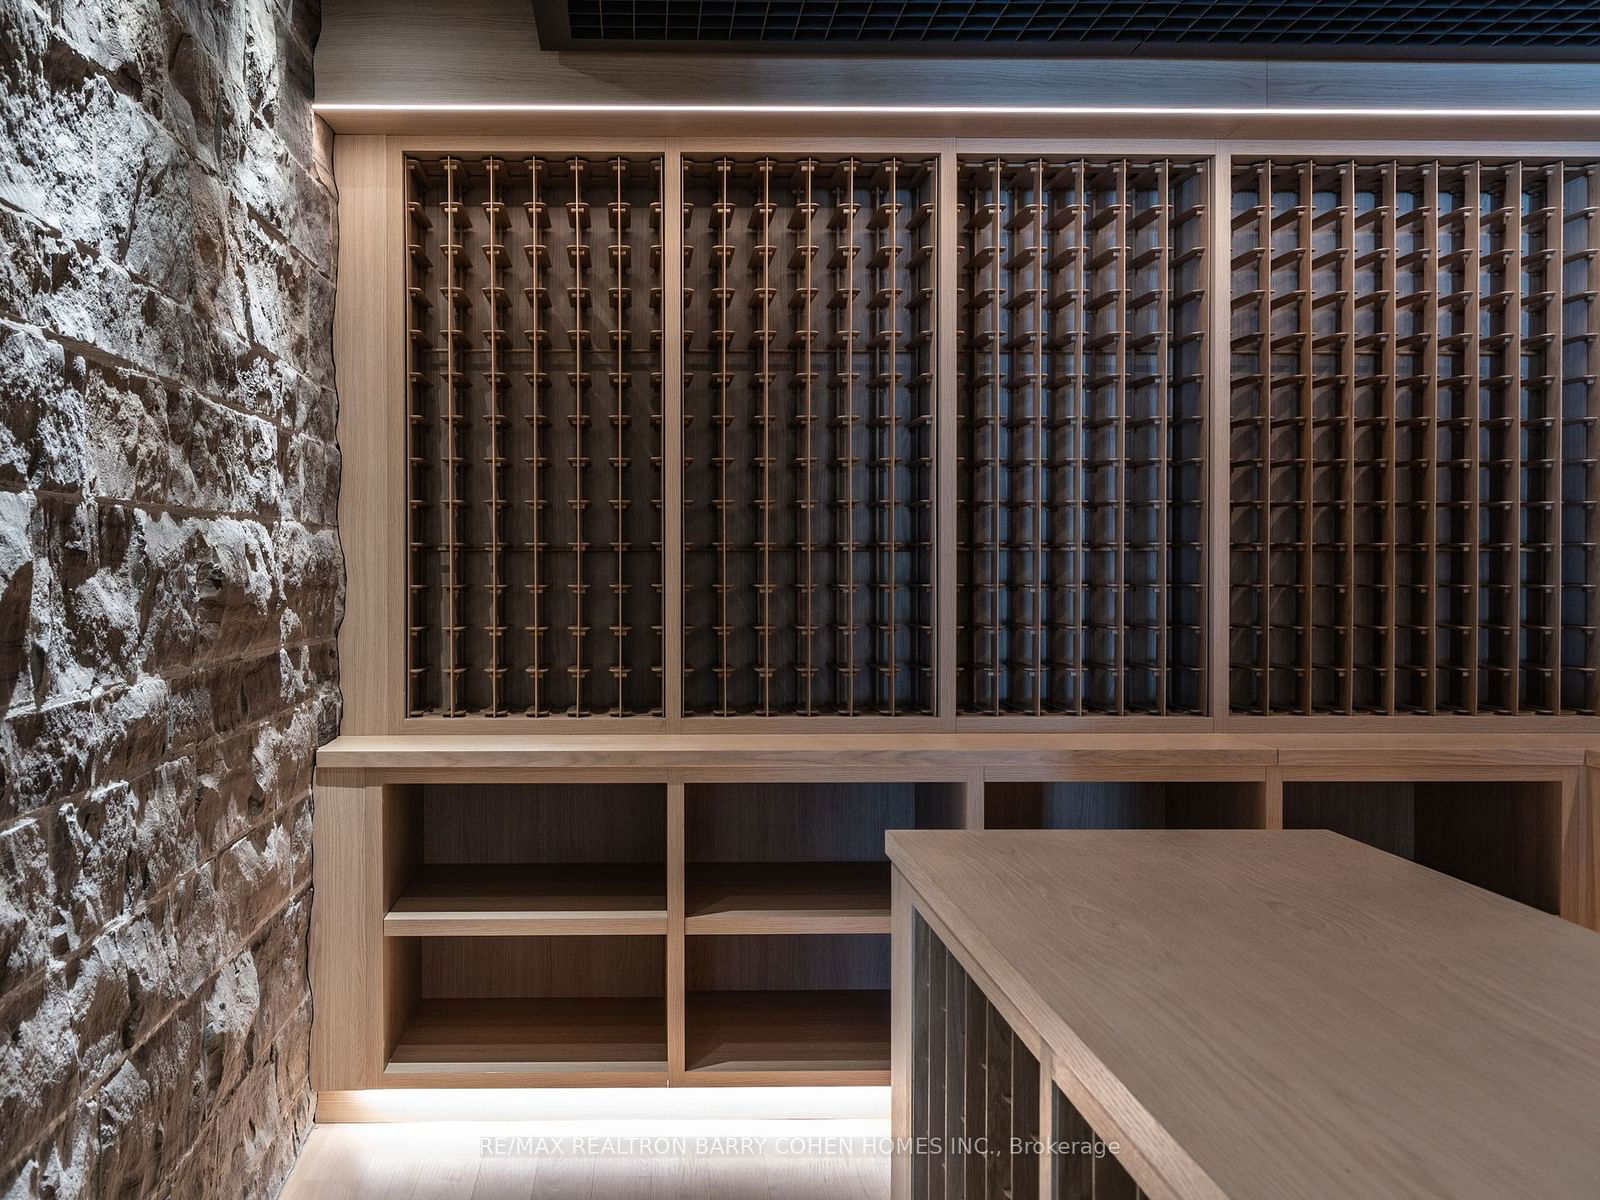
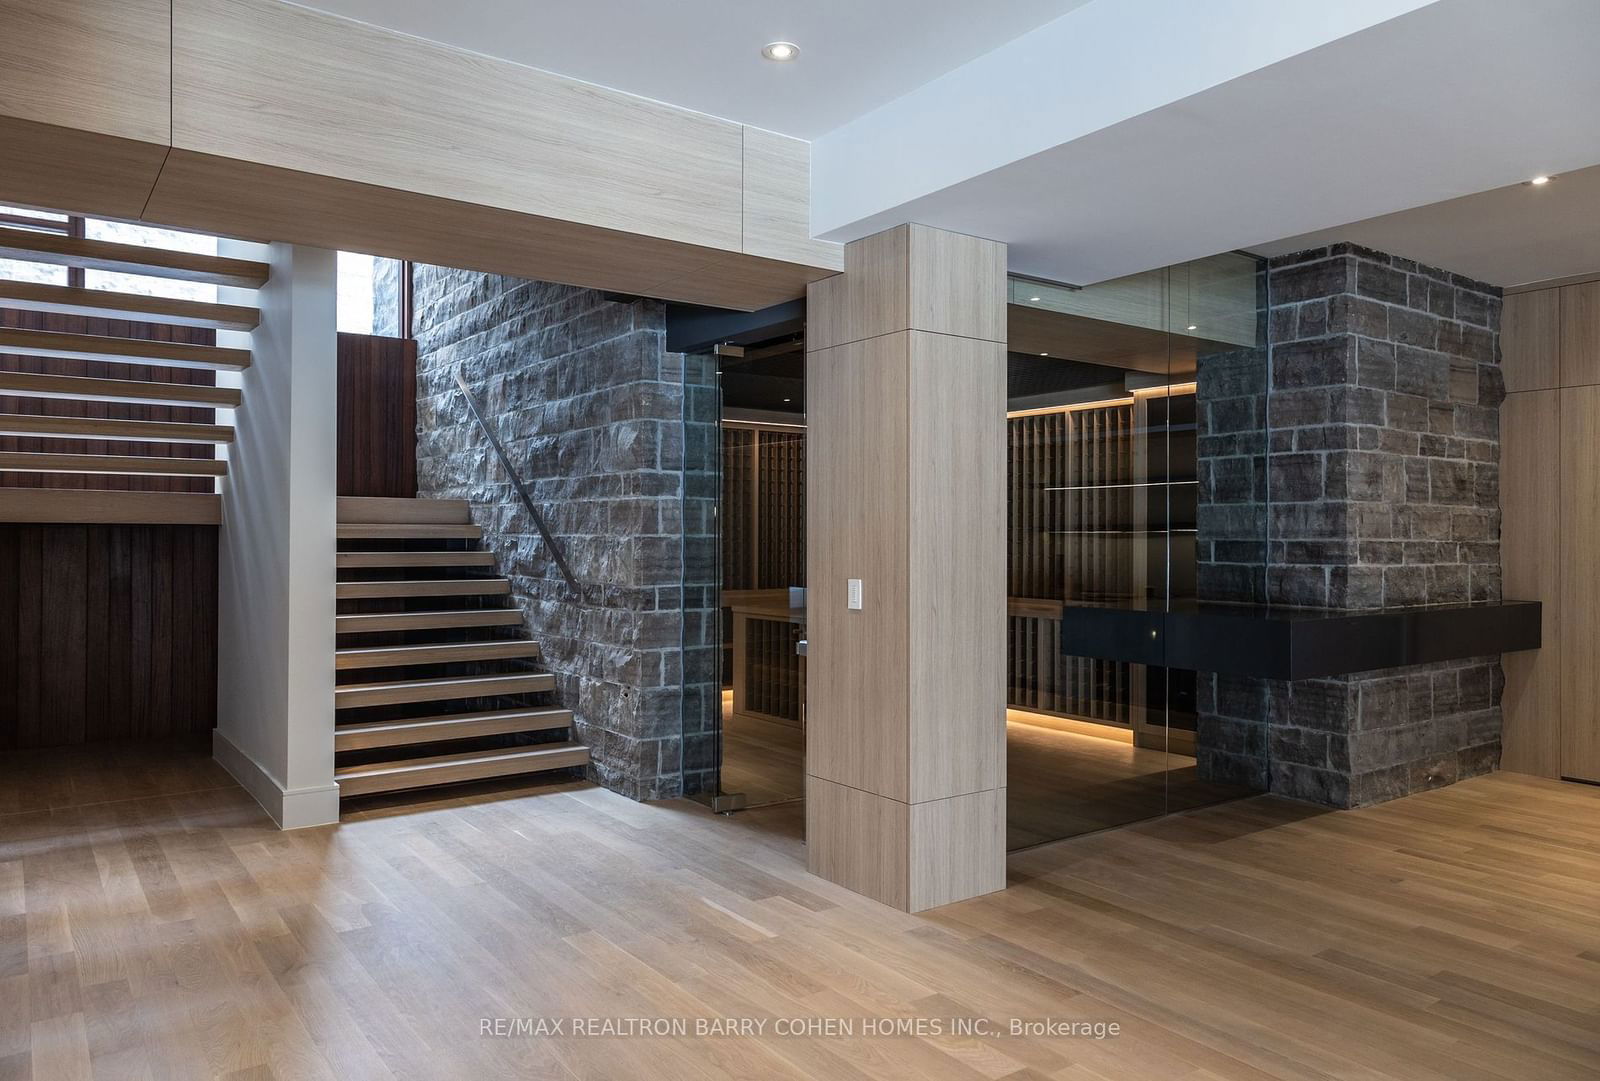
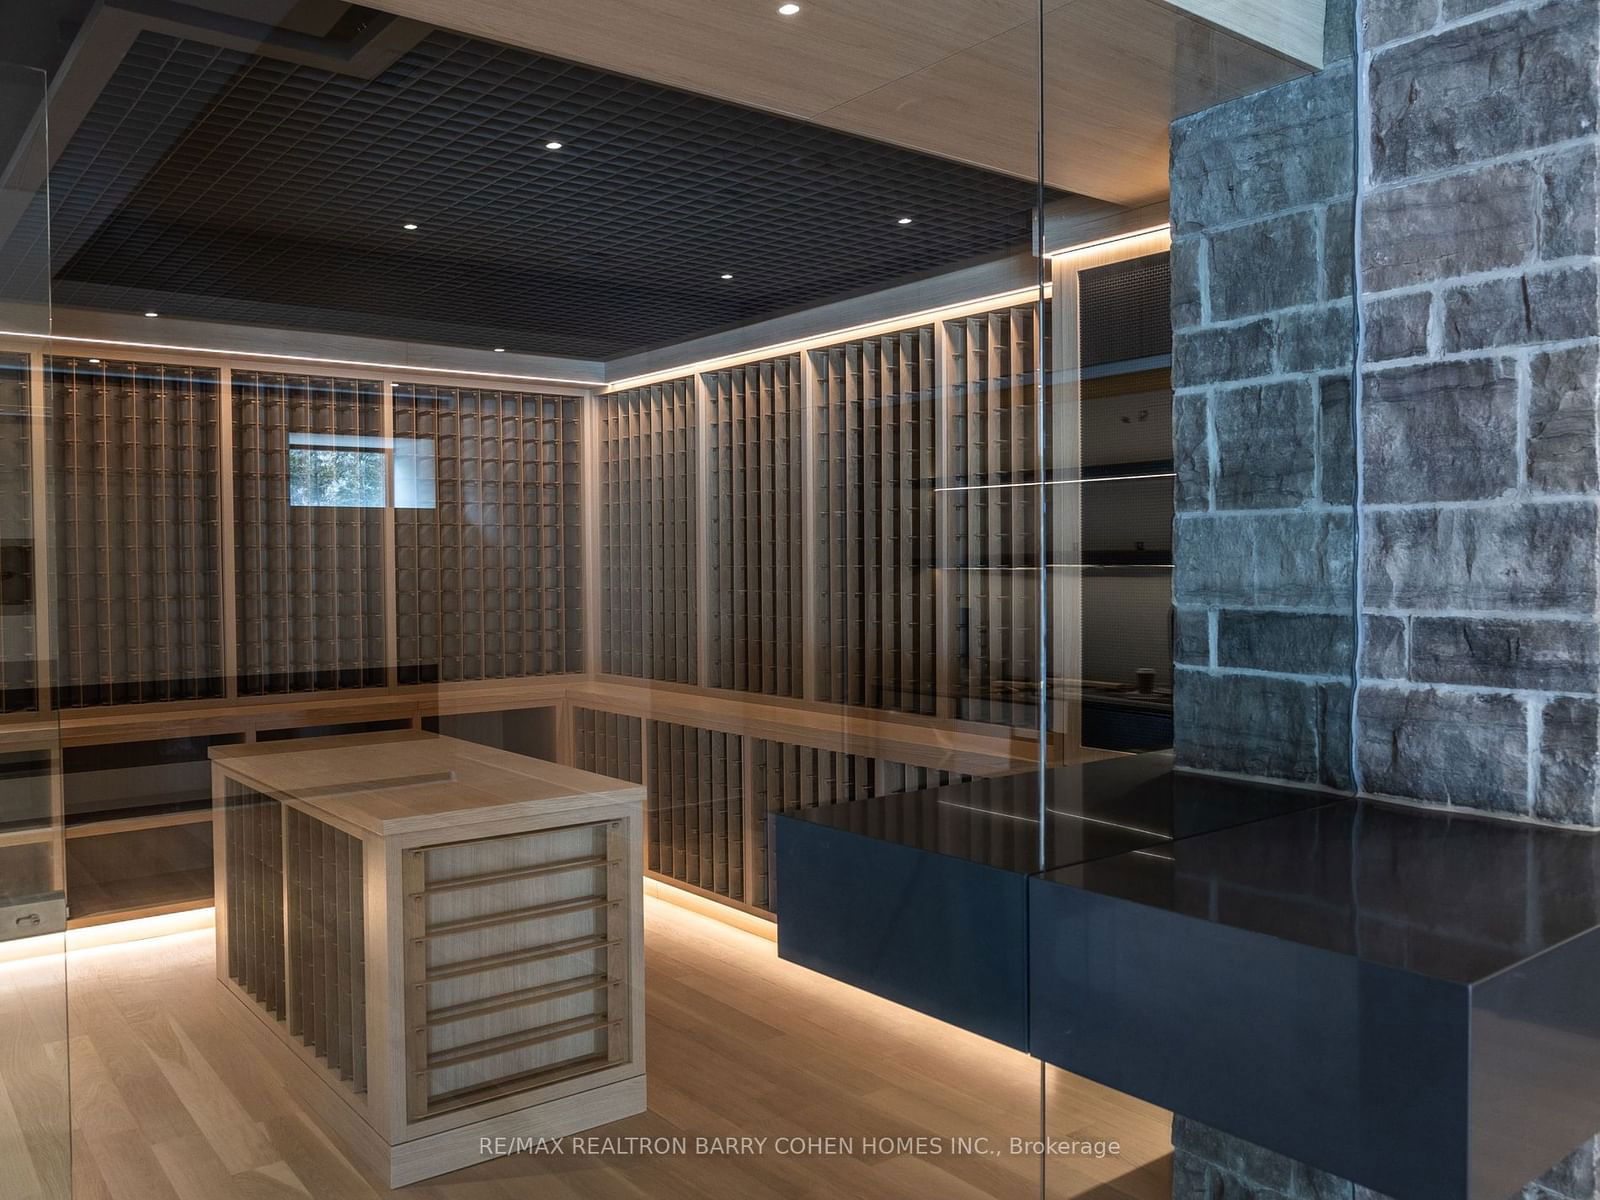
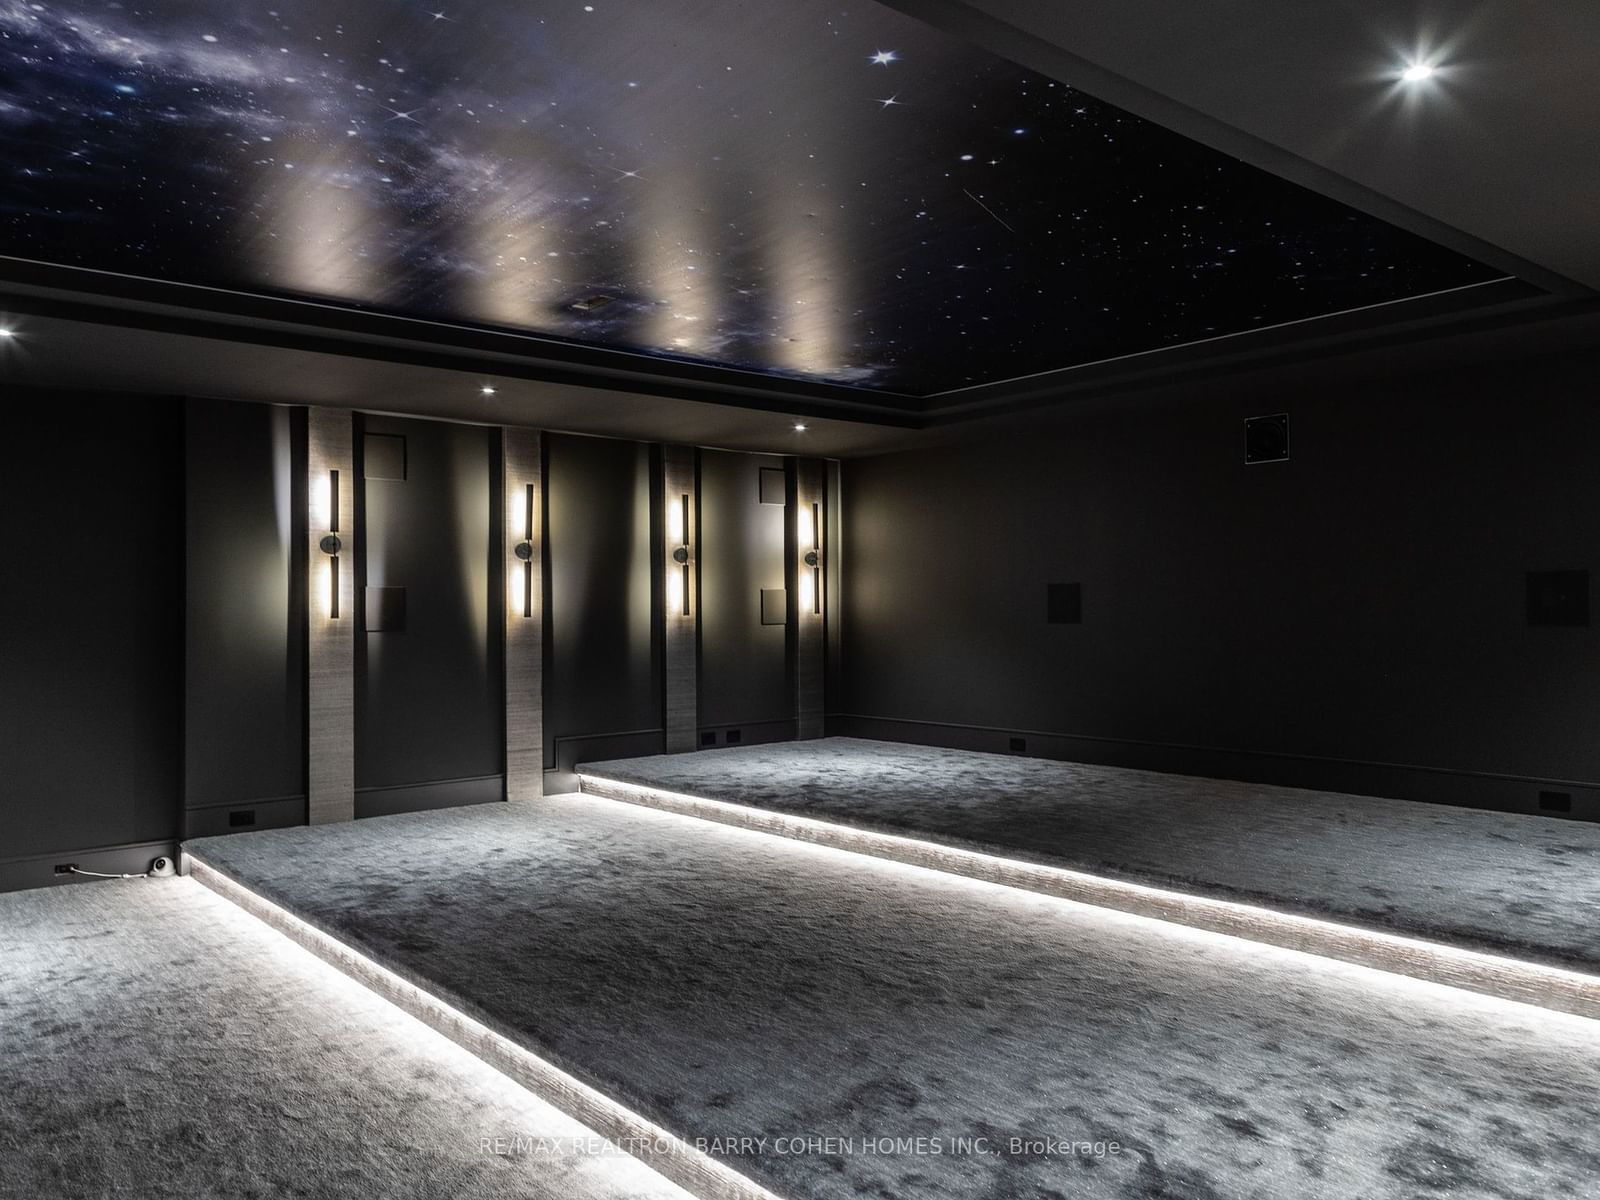
Nestled Within One Of Toronto's Most Esteemed Neighborhoods, This Exceptional Residence Stands As A Testament To Unparalleled Design & Luxurious Living. Conceptualized, Designed, & Meticulously Executed By The Renowned Architectural Visionary Michael McCann & Distinguished Architectural Designer & Builder Lisa Mandel McCann. This Home Is A True Work Of Art, Inspired By Its Natural Surroundings & Harmonizing With The Delicate Balance Of Nature. Spanning An Impressive 21,000 Square Feet, This Intricately Detailed Living Space Is Situated On Approximately One Acre Of A Park-Like Oasis. It Offers The Perfect Blend Of Luxury And Comfort. Just A Short Distance From Downtown Toronto, Residents Enjoy Easy Access To Fine Dining, Upscale Shopping, & Some Of The Best Schools In The City. The Exterior Of This Home Is A Marvel, Featuring A Superb Outdoor Space With A Tennis & Sports Court, A Hot Tub, & Numerous Lounging Areas. The Pool & Cabana Areas Are Designed For Ultimate Relaxation Within The Tranquil Environment. The Interior Is Designed To Withstand The Test Of Time, Showcasing Innovation & Functionality Throughout. Rich Finishings Of Walnut, White Oak, Bronze, Limestone, Marble, & Backlit Quartz Are Used Extensively, With Cascading Natural Light Creating A Uniquely Distinct Warmth In Every Room. This Home Offers A Living Experience That Is Both Opulent & Serene. Every Detail Has Been Thoughtfully Considered, Making It A Rare & Exquisite Property In One Of Toronto's Most Coveted Locations. **EXTRAS** Chef's Gour.Kit.W/ Additional Discreet Caterer's Kit. World Class Wine Room. Home Voice Automation. Enriched Airport Level Security, Groundbreaking 8K Ready Tech.
Foyer
Living
Dining
Kitchen
Family
Library
Prim Bdrm
2nd Br
3rd Br
4th Br
5th Br
Media/Ent
The graph below compares the average list price and average sale price of homes in this neighborhood by month for the last 24 months. When average sale price is greater than average list price, this may suggest a buyer's market. When average sale price is lower than the average list price this may suggest a seller's market.
The graph below illustrates the average days on market for homes in this neighborhood. The yellow area may indicate a buyer's market, the green area may indicate a balanced market and the red area may indicate a seller's market.
Sales Representative, Century 21 People’s Choice Realty Inc., Brokerage
(647) 576 - 2100